How To Make a Cumulative Relative Frequency Table
TLDRThis video demonstrates how to construct a cumulative relative frequency table using a data set. It first explains creating columns for value, frequency, relative frequency and cumulative relative frequency. It then tallies the values' frequencies, sums them to get the total frequency, and divides individual frequencies by the total to calculate relative frequencies. After verifying relative frequencies sum to 1, it cumulatively adds them to populate the last column. Finally, it emphasizes the utility of these tables and reminds viewers to subscribe.
Takeaways
- 😀 We are going to make a cumulative relative frequency table using provided data
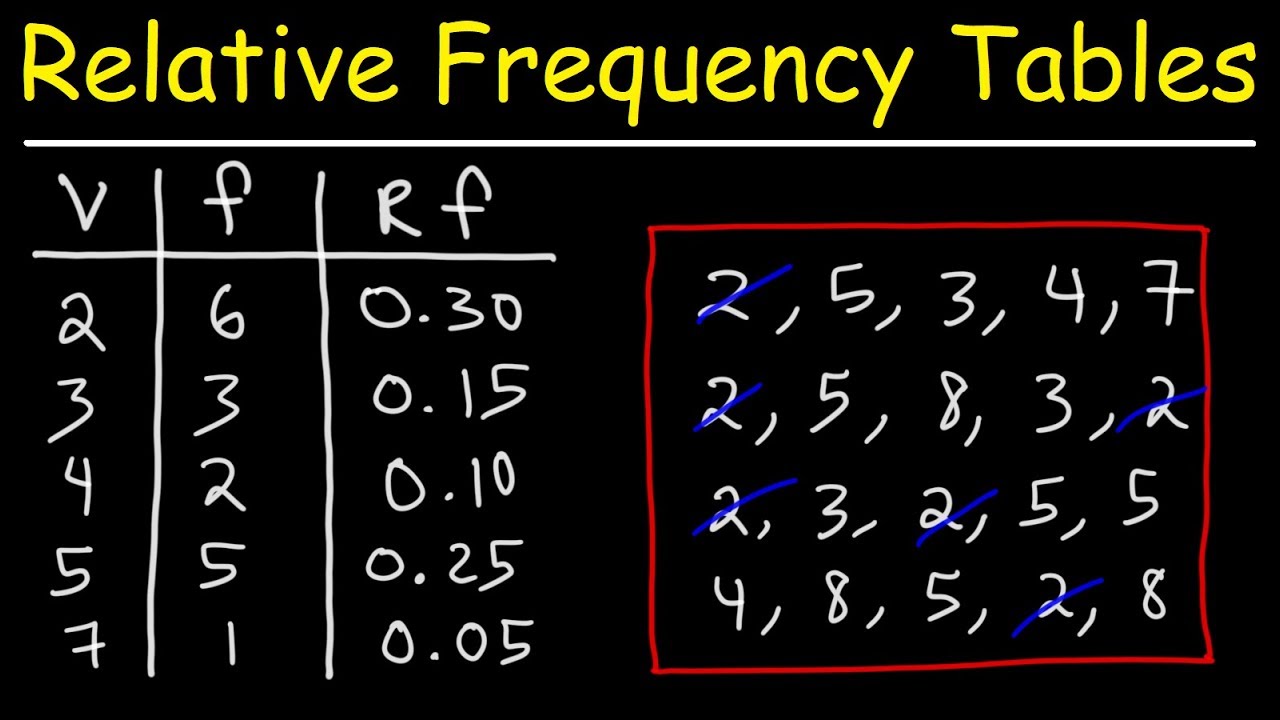
- 👍🏻 The table will have 4 columns: Value, Frequency, Relative Frequency, and Cumulative Relative Frequency
- 📝 We count the frequency for each unique data value
- 🔢 We calculate the total frequency by summing the Frequency column
- 🧮 Relative Frequency is calculated by Frequency divided by Total Frequency
- 🔄 We verify Relative Frequencies sum to 1 before continuing
- ↗️ Cumulative Relative Frequency starts with the Relative Frequency
- ↗️ Then each next Cumulative Relative Frequency adds the previous Relative Frequency
- 📈 The final Cumulative Relative Frequency reaches 1.0 when complete
- 👋 Don't forget to subscribe and thanks for watching the video
Q & A
What are the four columns created in the frequency table?
-The four columns created are: V for value, F for frequency, RF for relative frequency, and CRF for cumulative relative frequency.
How many total data values are there in the data set?
-There are a total of 25 data values in the data set.
What is the frequency of the number 3 in the data set?
-The frequency of the number 3 is 8.
What is the relative frequency of the number 5?
-The relative frequency of the number 5 is 0.16.
What is the purpose of taking the sum of the relative frequency column?
-Taking the sum verifies that the relative frequencies add up to 1, which they should.
How is cumulative relative frequency calculated?
-Cumulative relative frequency is calculated by adding the current relative frequency to the previous cumulative relative frequency.
Why create a cumulative relative frequency table?
-A cumulative relative frequency table allows you to see the cumulative distribution of the data, not just the individual frequencies.
What is the cumulative relative frequency for the number 8?
-The cumulative relative frequency for the number 8 is 0.88.
What is the purpose of this video?
-The purpose is to demonstrate the process of creating a cumulative relative frequency table from a data set.
What is the final cumulative relative frequency value and what does it represent?
-The final cumulative relative frequency value is 1.0. This represents 100% of the data set.
Outlines
😄 Creating a Cumulative Relative Frequency Table
The paragraph explains the step-by-step process of creating a cumulative relative frequency table using a given data set. It goes through calculating the frequencies, relative frequencies, and cumulative relative frequencies for each value in the data. Key steps include determining the frequency counts, summing the frequencies, calculating relative frequencies by dividing frequencies by the total, ensuring relative frequencies sum to 1, and calculating cumulative relative frequencies by adding up the previous relative frequencies.
Mindmap
Keywords
💡frequency
💡relative frequency
💡cumulative relative frequency
💡table
💡distribution
💡calculate
💡proportion
💡sum
💡value
💡frequency distribution
Highlights
We're going to focus on making a cumulative relative frequency table using the data
The first column will be for the data values, the second for frequencies, the third for relative frequencies, and the last for cumulative relative frequencies
We count the occurrences of each data value to populate the frequency column
We take the sum of the frequencies as the total frequency needed to calculate relative frequencies
Relative frequency is calculated by dividing each frequency by the total frequency
We check that the relative frequencies sum to 1 before continuing
Cumulative relative frequency starts with the first relative frequency value
Each cumulative relative frequency adds the next relative frequency value
The final cumulative relative frequency should equal 1
This table allows us to analyze the distribution and cumulative distribution of the data
It's helpful for statistical analysis like finding percentiles
Great for visualizing the proportion of data below or above thresholds
Important for probability and sampling applications
Useful precursor to more advanced statistical approaches
Consider graphing distributions or relationships once table is built
Transcripts
Browse More Related Video


5.0 / 5 (0 votes)
Thanks for rating: