Dot Plots and Frequency Tables
TLDRThe video demonstrates how to create frequency tables and dot plots to visually represent data sets. It provides step-by-step guidance on tabulating the frequencies of values in a data set to build a frequency table. It then shows how to convert the frequency table into a dot plot by plotting each value on a number line with a number of dots representing the frequency. The video explains how to read the graphical dot plot to identify key features of the data set like the mode and median. It aims to teach the viewer these data analysis techniques through clear explanations and worked examples.
Takeaways
- 😀 The first step is to write a list of numbers to work with
- 👍🏻 Make a frequency table with 2 columns: values and frequencies
- 📊 List each unique number and tally how often it appears
- 📈 Order the values from lowest to highest in the table
- 📉 Then make a dot plot by creating a number line with those values
- 🔢 Place a dot above each value for each time it appears
- 🎯 The mode is the number with the highest frequency
- ⏺️ Eliminate dots from both ends to find the median in the center
- 😎 You can construct dot plots without first making frequency tables
- 📌 Useful for visualizing and analyzing the distribution of data
Q & A
What are the two things we are going to focus on in the video?
-Making frequency tables and dot plots.
What are the two columns in a frequency table?
-The first column shows the values or numbers. The second column shows the frequency or count of each value.
How do you determine which numbers to include in the frequency table?
-You include the lowest and highest numbers that appear in the number list. Then you include all numbers in between, even if they do not appear in the list.
How do you go from a frequency table to a dot plot?
-For each number on the number line, you place a dot above that number equal to its frequency count in the table.
What number represents the mode in the first dot plot example?
-The mode is 8 because it has the highest frequency count of 5 in the table.
How do you determine the median number for the first dot plot?
-Eliminate dots from the left and right until there are two dots remaining. Take the average of those two numbers. In this case, 5 and 6 so the median is 5.5.
What is the mode in the second dot plot example?
-The mode in the second example is 9 because it has the highest frequency of 5.
What purpose does a dot plot serve over just listing numbers?
-A dot plot allows you to visualize the data and see the frequency or popularity of certain numbers.
Could you create a bar graph instead of a dot plot to display this data?
-Yes, you could create a bar graph with the values along the x-axis and the frequencies or counts on the y-axis.
What is a limitation of using a frequency table and dot plot?
-A limitation is that it works for numerical data but not categorical data. It also does not show averages or spreads like some other statistical plots.
Outlines
😀 Making a Frequency Table and Dot Plot
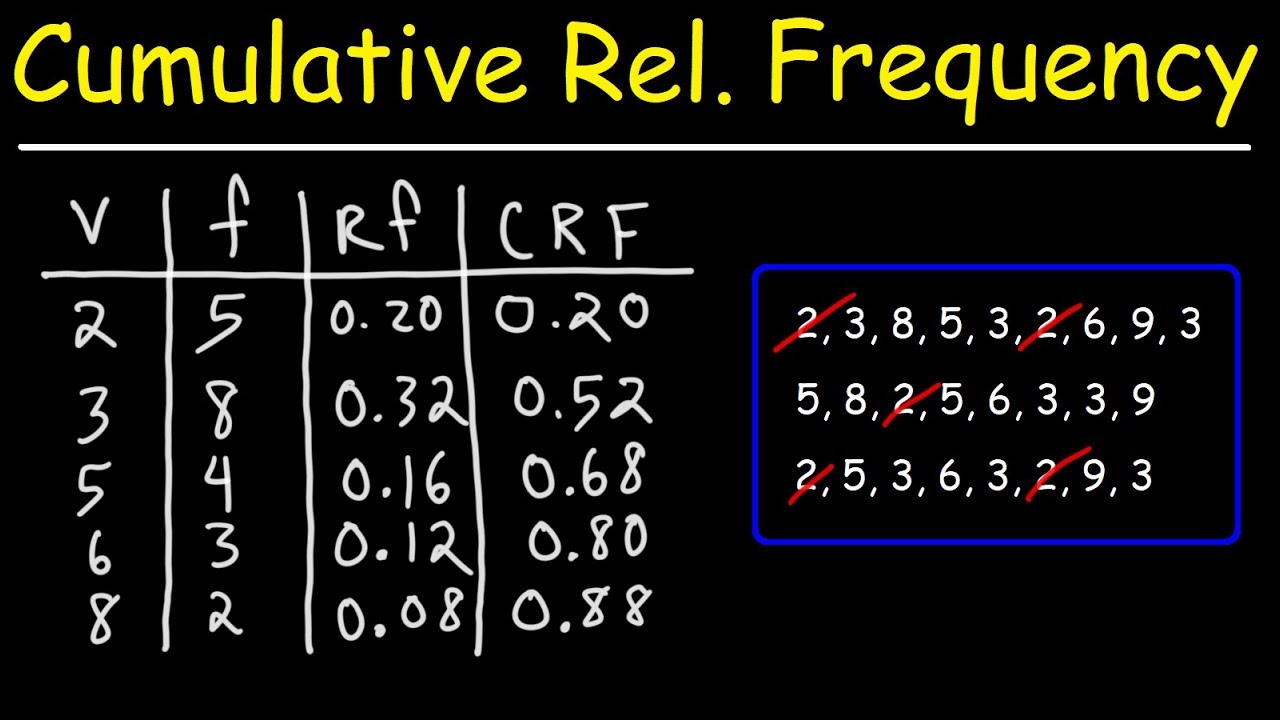
This paragraph explains how to construct a frequency table and corresponding dot plot from a list of numbers. It steps through an example, listing the numbers 5, 8, 3, 6, 8, 5, 8, 2, 3, 8, 5, 8, 3, 5, 7, 6, determining the frequency of each unique number, and using the frequencies to plot dots above the associated values along a number line.
😊 Converting the Frequency Table into a Dot Plot
This paragraph continues the example, demonstrating how to convert the completed frequency table into a dot plot. It explains placing a dot above each number for the corresponding frequency from the table. It then identifies how to determine the mode (highest frequency/most dots) and median (middle value) from the completed dot plot.
Mindmap
Keywords
💡frequency table
💡dot plot
💡mode
💡median
💡list of numbers
💡number line
💡frequency
💡lowest value
💡highest value
💡order
Highlights
We're going to focus on making frequency tables and dot plots
Let's begin by writing a list of a few numbers that we'll use as example data
We make a frequency table with two columns: the values and the frequencies showing how often each value occurs
We create a dot plot by placing dots above each value on a number line, with the number of dots corresponding to the frequencies
Looking at the dot plot, the mode is the number with the highest frequency or greatest number of dots
To find the median, eliminate dots from both sides until reaching the middle values
Let's construct another dot plot from a new set of example data to practice the process again
Make a dot plot without first making a frequency table, just use the new data values directly
The lowest and highest numbers define the range for the number line
Place dots above each value corresponding to its frequency in the data set
From the new dot plot we can clearly see that 9 is the mode, with the highest frequency
That's how you can make a dot plot given a list of numbers
Frequency tables summarize the occurrence of each data value
Dot plots provide a visual distribution of the data values
The mode, median, and shape of distribution are apparent in dot plots
Transcripts
Browse More Related Video


5.0 / 5 (0 votes)
Thanks for rating: