Position vs Time, Velocity vs Time & Acceleration vs Time Graph (Great Trick to Solve Every Graph!!)
TLDRThis educational script explains the fundamental concepts of motion graphs in physics, focusing on position, velocity, and acceleration versus time. It illustrates how to represent motion with these graphs and how to convert from one type to another by analyzing slopes at various time points. The script emphasizes the importance of understanding slopes, as they indicate the velocity at a given time on a position-time graph and acceleration on a velocity-time graph. It also introduces the concept of jerk as the derivative of acceleration over time. The key takeaway is learning to interpret and translate these graphs to understand an object's motion throughout different time intervals.
Takeaways
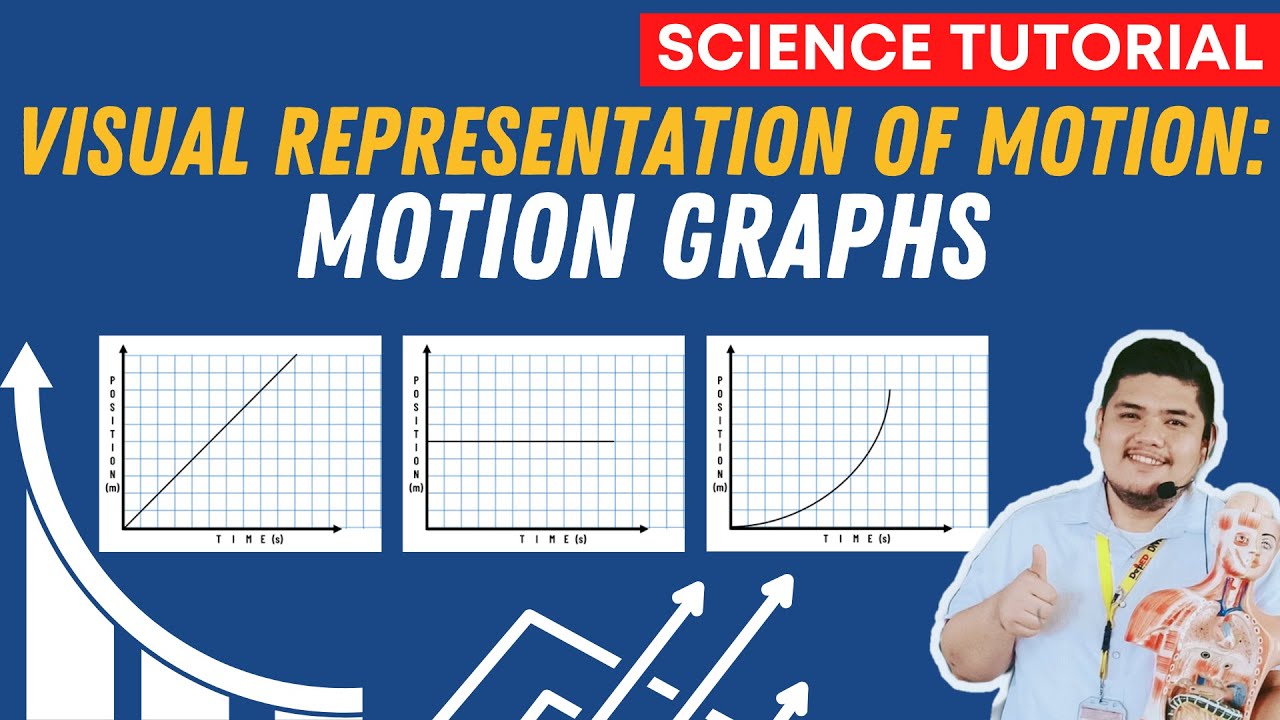
- 📈 The script explains how to represent motion using three types of graphs in physics: position versus time, velocity versus time, and acceleration versus time.
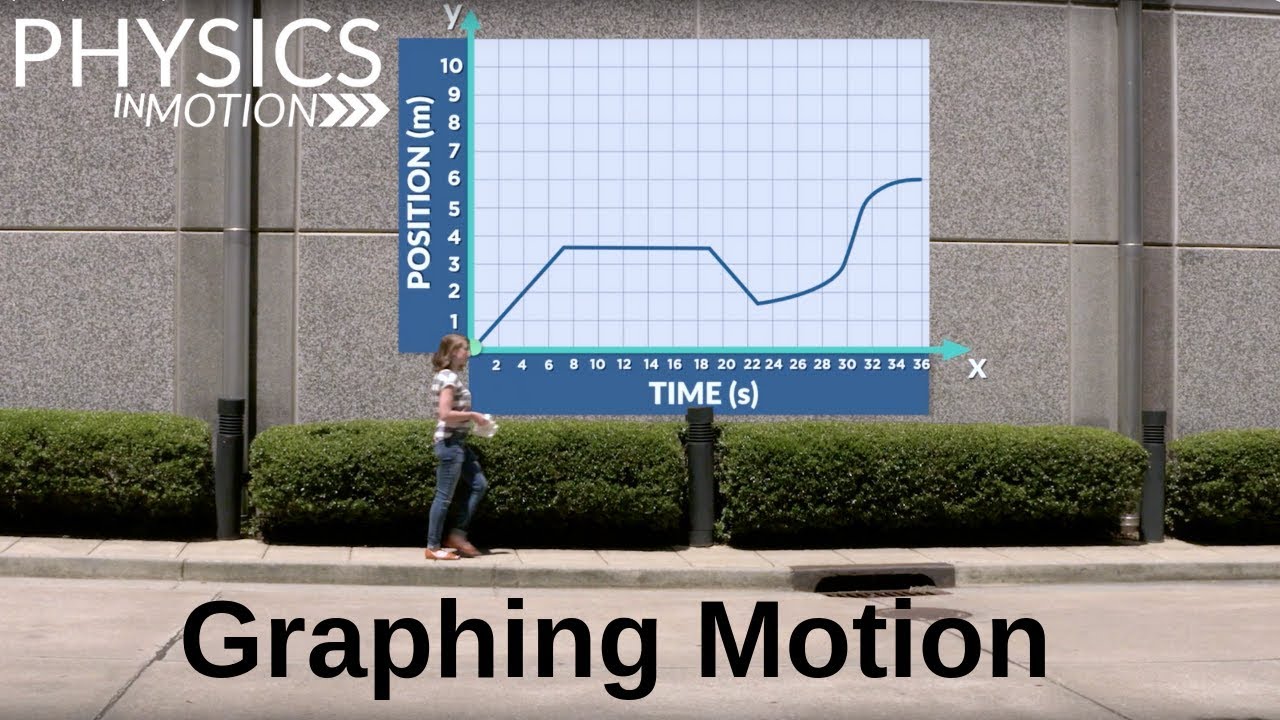
- 📊 A position versus time graph is created by plotting points at specific time intervals to show an object's movement, such as a baseball moving from 0 to 3 meters in 3 seconds.
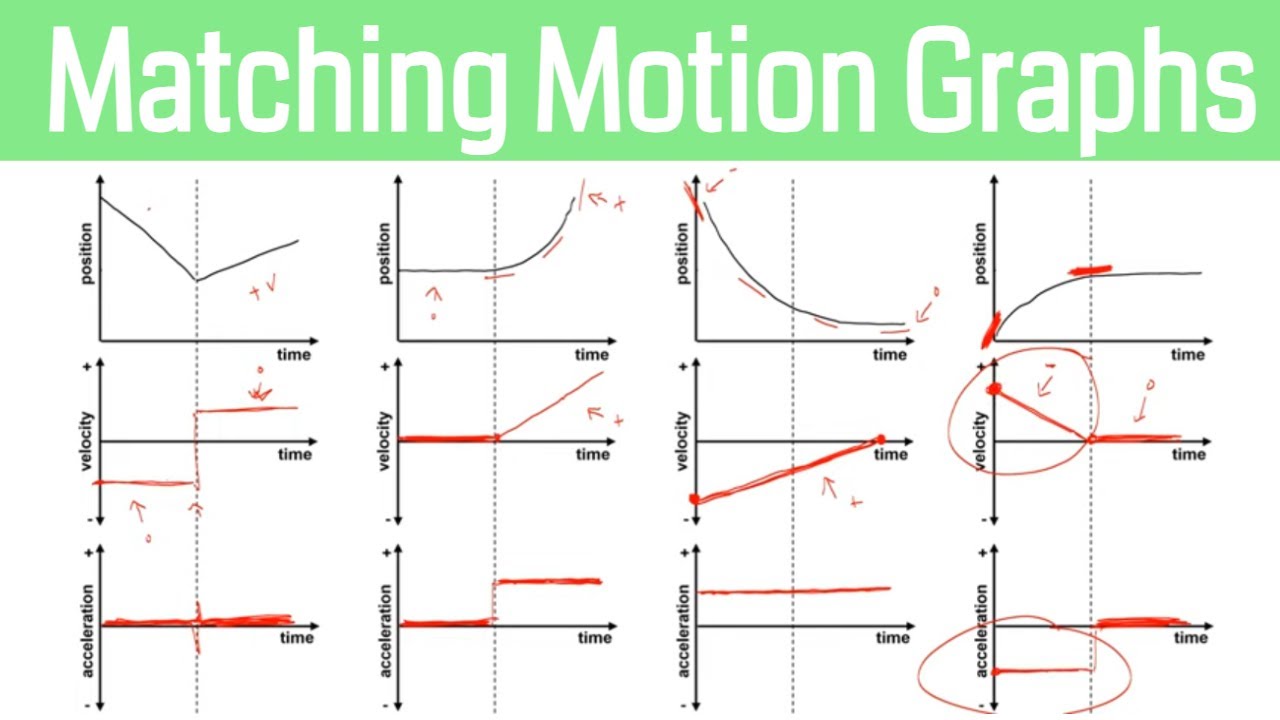
- 📉 To convert a position versus time graph into a velocity versus time graph, one must understand the concept of slope, which represents the rate of change of position over time.
- 🚀 The slope of the position versus time graph at any given time point indicates the velocity at that time; a slope of 1 means a velocity of 1 unit per second.
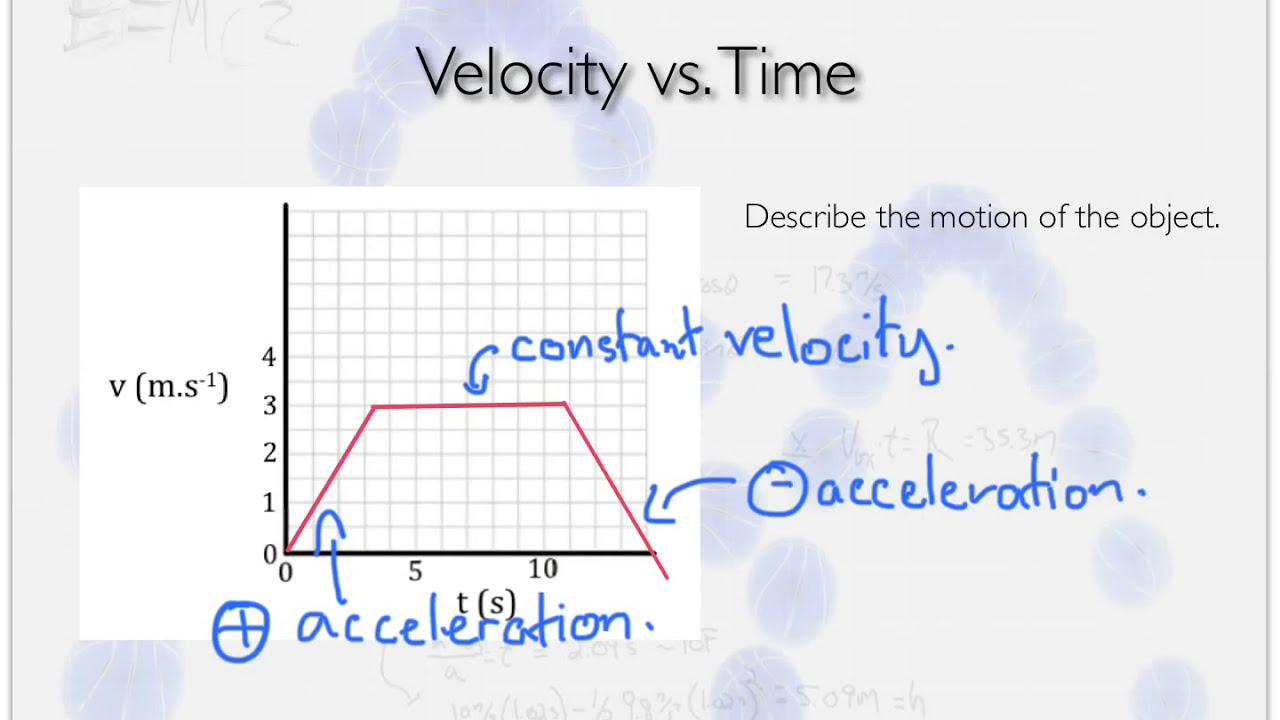
- 🔍 To find acceleration, which is the rate of change of velocity, one must examine the slope of the velocity versus time graph; a slope of 0 indicates no change in velocity, or constant velocity.
- 📚 The script emphasizes the importance of focusing on a single time point to determine the slope and numerical value for position, velocity, and acceleration graphs.
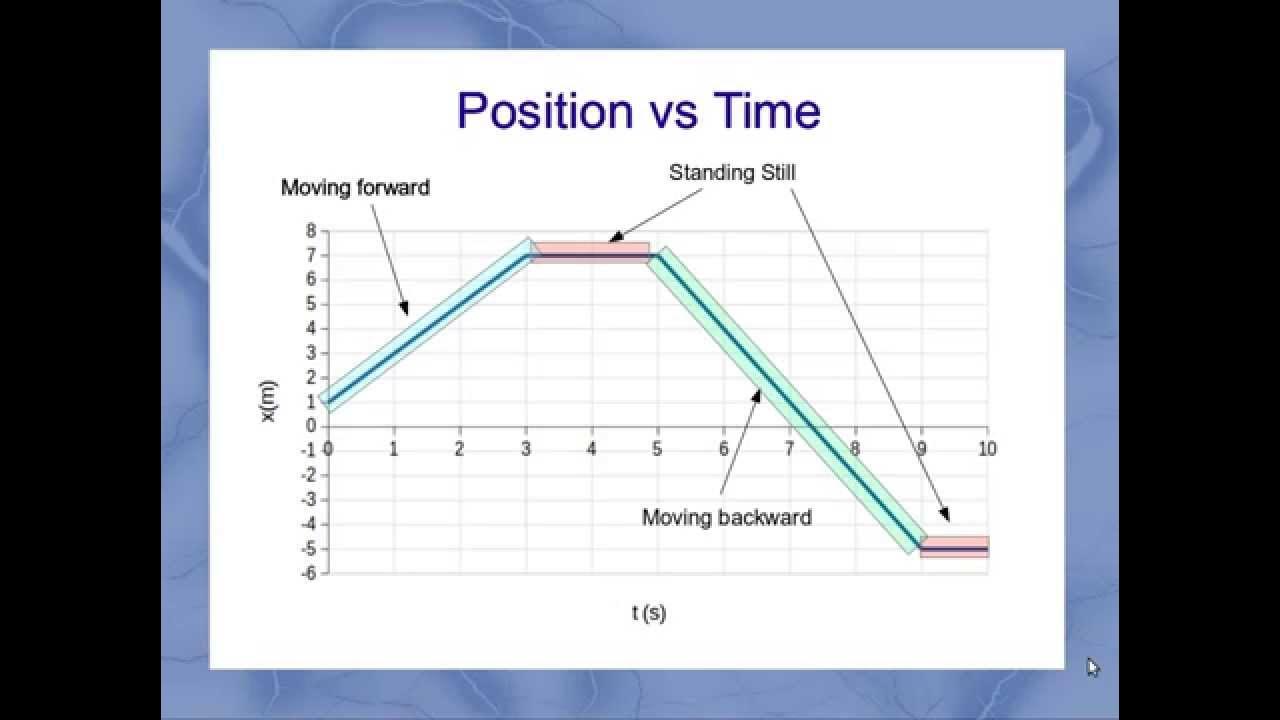
- 🔢 Negative slopes in position versus time graphs indicate a movement in the opposite direction, and the magnitude of the slope represents the rate of change.
- 📉 The velocity versus time graph shows how the speed of an object changes over time, with the slope of the graph indicating the acceleration at each time point.
- 📈 The acceleration versus time graph represents the rate at which the velocity of an object is changing, with a constant slope indicating uniform acceleration.
- 🔑 Memorizing the rules for converting between position, velocity, and acceleration graphs is crucial for understanding motion in physics.
- 📚 The script suggests taking a screenshot of the graphs and rules for easy reference, as they are fundamental for solving physics problems and preparing for exams like the MCAT.
Q & A
What are the three major types of graphs used in physics to represent motion?
-The three major types of graphs used in physics to represent motion are position versus time graphs, velocity versus time graphs, and acceleration versus time graphs.
How is the motion of a baseball represented on a position versus time graph?
-The motion of a baseball is represented on a position versus time graph by plotting points at different time intervals, showing the position of the baseball at each time. For example, at time zero, it's at the zero-meter mark, at one second it's at the one-meter mark, at two seconds it's at the two-meter mark, and so on.
What is the concept of slope in the context of graphs and how is it used to determine velocity?
-In the context of graphs, the slope represents the steepness of a line and is calculated as the 'rise over run'. The slope of the position versus time graph indicates the velocity at a given time point. A positive slope means the object is moving in the positive direction, a negative slope indicates motion in the negative direction, and a slope of zero means the object is at rest.
How do you convert a position versus time graph into a velocity versus time graph?
-To convert a position versus time graph into a velocity versus time graph, you need to determine the slope of the position graph at different time points. The slope at each time point represents the velocity at that time. If the slope is constant, the velocity is constant; if the slope changes, the velocity changes accordingly.
What does the slope of a velocity versus time graph represent?
-The slope of a velocity versus time graph represents the acceleration at a given time point. A positive slope indicates acceleration in the positive direction, a negative slope indicates deceleration or acceleration in the negative direction, and a slope of zero indicates that the velocity is constant, meaning there is no acceleration.
How can you find the acceleration from a velocity versus time graph?
-To find the acceleration from a velocity versus time graph, you calculate the slope of the velocity graph at different time points. The slope at each time point is the acceleration at that time. If the slope is constant, the acceleration is constant; if the slope changes, the acceleration changes accordingly.
What is the relationship between the slope of a graph and the physical quantity it represents?
-The slope of a graph in physics directly relates to the rate of change of the physical quantity being represented. For position versus time graphs, the slope is velocity; for velocity versus time graphs, the slope is acceleration. The sign of the slope indicates the direction of the change.
Can a position versus time graph have a negative slope, and what would it mean?
-Yes, a position versus time graph can have a negative slope. A negative slope indicates that the object is moving in the negative direction along the axis, which means it is moving backward or in the opposite direction from the defined positive direction.
What does a slope of zero in a velocity versus time graph indicate about the motion of an object?
-A slope of zero in a velocity versus time graph indicates that the velocity of the object is constant over that time interval. This means there is no acceleration or deceleration occurring; the object is moving at a uniform speed.
How can the concept of slope help in understanding the motion of an object in physics?
-The concept of slope helps in understanding the motion of an object by providing a visual representation of how the object's velocity and acceleration change over time. By analyzing the slope of position versus time and velocity versus time graphs, one can determine the speed, direction, and changes in the motion of an object.
Why is it important to focus on a single time point when converting from one type of graph to another?
-Focusing on a single time point is important because it allows for the accurate determination of the physical quantity (like velocity or acceleration) at that specific moment. It simplifies the analysis by considering the instantaneous rate of change, which is represented by the slope at that point on the graph.
Outlines
📊 Understanding Motion Graphs in Physics
This paragraph introduces the concept of representing motion through different types of graphs commonly used in physics: position versus time, velocity versus time, and acceleration versus time. It uses the example of a baseball moving through space to illustrate how each graph type would represent the motion. The paragraph explains the process of creating a position versus time graph by plotting the position of the baseball at different time intervals. It then delves into how to convert this graph into a velocity versus time graph by understanding and calculating the slope of the position graph, which represents the velocity at a given time point.
📈 Converting Position to Velocity and Velocity to Acceleration Graphs
Building upon the foundation laid in the first paragraph, this section focuses on the transition from a position versus time graph to a velocity versus time graph and subsequently to an acceleration versus time graph. It emphasizes the importance of recognizing the slope of the lines in the graphs, where the slope of the position graph at any given time indicates the velocity, and the slope of the velocity graph indicates the acceleration at that time. The paragraph provides examples of different slopes, both positive and negative, and explains how these slopes translate to the corresponding velocities and accelerations.
🔍 Detailed Analysis of Graph Conversions for Motion
This paragraph continues the discussion on graph conversions with a more detailed analysis. It provides step-by-step instructions on how to focus on individual time points and determine the slope of the position versus time graph to find the corresponding velocity. Similarly, it explains how to find the acceleration by examining the slope of the velocity versus time graph. The paragraph further illustrates this with various examples, including scenarios where the slope is zero, positive, negative, or changes over time, showing how these changes in slope reflect the object's motion.
📚 Advanced Graph Interpretations and Practical Applications
The final paragraph presents more complex examples to solidify the understanding of graph conversions for motion analysis. It guides through the process of interpreting the position, velocity, and acceleration graphs for different scenarios, including when the slope is constant or changes at different time intervals. The paragraph also touches on the concept of jerk as the derivative of acceleration with respect to time, suggesting further study on how to infer distance traveled and change in velocity from the graphs. It concludes with a recommendation to take a screenshot of the graphs for reference, highlighting their importance in physics and standardized tests like the MCAT.
Mindmap
Keywords
💡Baseball
💡Position versus Time Graph
💡Velocity
💡Slope
💡Acceleration
💡Rise Over Run
💡Negative Slope
💡Derivative
💡Jerk
💡MCAT
Highlights
Introduction to representing motion of an object using three major types of graphs in physics: position vs. time, velocity vs. time, and acceleration vs. time.
Explanation of how to represent motion using a position versus time graph with examples of a baseball moving through space.
Understanding the concept of slope to convert position versus time graph into a velocity versus time graph.
Illustration of calculating slope using the rise over run method with various examples.
Demonstration of how the slope of a position versus time graph indicates velocity at a given time point.
Conversion from velocity versus time graph to acceleration versus time graph by analyzing the slope of the velocity graph.
Example of a constant velocity scenario where the slope of the velocity versus time graph is zero, indicating no acceleration.
Detailed process of converting a given position versus time graph into a velocity versus time graph using slope analysis.
Explanation of how to derive the acceleration versus time graph from the velocity versus time graph using slope.
Use of color-coding to represent different regions of the graph and understand the changes in slope and numerical values.
Emphasis on the importance of focusing on single time points when converting graphs and understanding motion.
Complex example of translating a position versus time graph with varying slopes into a velocity versus time graph.
Further conversion of the derived velocity versus time graph into an acceleration versus time graph.
Illustration of how to handle a tricky region in the graph by carefully analyzing the slope and its numerical value.
Recommendation to take a screenshot of the graph examples for reference in understanding physics problems.
Introduction to the concept of jerk as the derivative of acceleration with respect to time.
Link to a video that teaches how to infer distance traveled and change in velocity from velocity and acceleration graphs.
Transcripts
Browse More Related Video

5.0 / 5 (0 votes)
Thanks for rating: