Statistics 101: Understanding Covariance
TLDRThis educational video introduces the concept of bivariate relationships, focusing on covariance, a key measure in finance and advanced statistics. The host uses a scatter plot of stock market data to demonstrate positive covariance, where variables move in the same direction. The video simplifies the mathematical formula for calculating covariance, contrasting it with correlation and linear regression. Aimed at beginners, the script provides a clear explanation of how covariance indicates the direction of a linear relationship without assessing its strength.
Takeaways
- 😀 Stay Positive: The video encourages viewers who may be struggling in a class to maintain a positive attitude and confidence in their abilities.
- 📚 Follow for Updates: The speaker invites viewers to follow on YouTube and Twitter for updates on new video uploads.
- 👍 Engage with Content: Viewers are encouraged to like, share, and comment on the video to provide feedback and support the creation of more content.
- 📉 Understand Covariance: The video focuses on explaining the concept of covariance, its importance in finance and higher-level statistics, and its role in understanding relationships between two variables.
- 📈 Analyze Data with Covariance: The script uses a real-world example of stock market indexes to illustrate how covariance can be used to analyze the relationship between variables.
- 🔢 Calculate Covariance: The video provides a step-by-step guide on how to calculate covariance using a sample dataset, emphasizing the formula and process.
- 📊 Interpret Results: It is explained that a positive covariance indicates an increasing linear relationship between variables, while a negative value indicates a decreasing relationship.
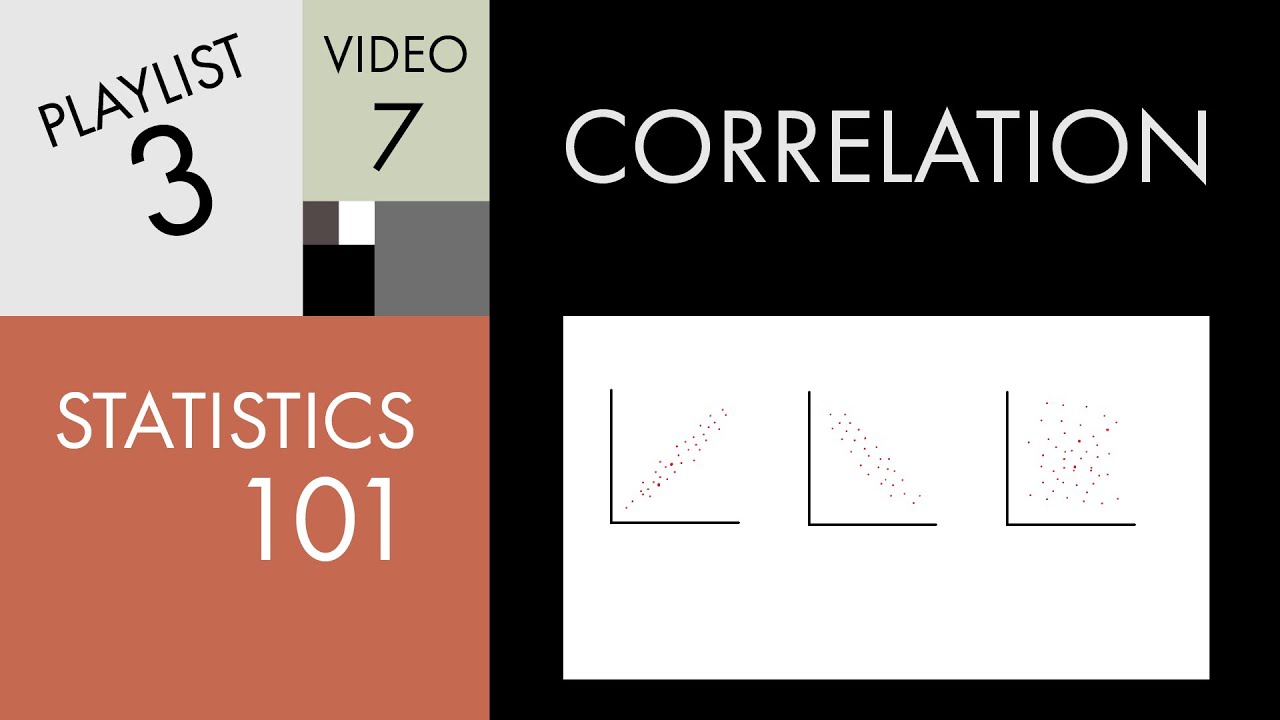
- 📋 Recognize Patterns: The script explains how to interpret the direction of the relationship between variables by looking at the pattern of data points in a scatter plot.
- 🔗 Connection to Other Concepts: Covariance is presented as a foundational concept that is closely related to correlation and linear regression, setting the stage for further statistical analysis.
- 👨🏫 Educational Intent: The video is designed for individuals new to statistics, with the intention of providing a slow, deliberate explanation to ensure understanding of basic concepts.
Q & A
What is the main topic of the video series?
-The main topic of the video series is basic statistics, focusing on bivariate relationships, specifically starting with the concept of covariance.
Why is it important for viewers to stay positive when struggling in a class?
-It's important for viewers to stay positive because they have already accomplished a lot in their educational career, and with the right amount of hard work, practice, and patience, they can overcome their current challenges.
What is the difference between sample covariance and population covariance?
-The difference between sample covariance and population covariance lies in the denominator of their respective formulas. Sample covariance uses 'n-1' (where 'n' is the number of samples), while population covariance uses 'n'.
What does the term 'co-variance' mean in the context of this video?
-In the context of this video, 'co-variance' refers to a statistical measure that describes the direction of the linear relationship between two variables, indicating whether they move together in the same or opposite directions.
How does the video demonstrate the concept of covariance?
-The video demonstrates the concept of covariance by showing a real-world example of the returns for the S&P 500 and the Dow Jones Industrial Average, explaining how they tend to move together, indicating a positive covariance.
What is the significance of covariance in finance and higher-level statistics?
-Covariance is significant in finance and higher-level statistics because it helps to measure and understand the relationship between different variables, such as the returns of different stock indexes, which is crucial for investment analysis and risk management.
How does the video explain the relationship between covariance and correlation?
-The video explains that covariance and correlation are closely related, with covariance focusing on the direction of the linear relationship between two variables, while correlation also considers the strength of that relationship.
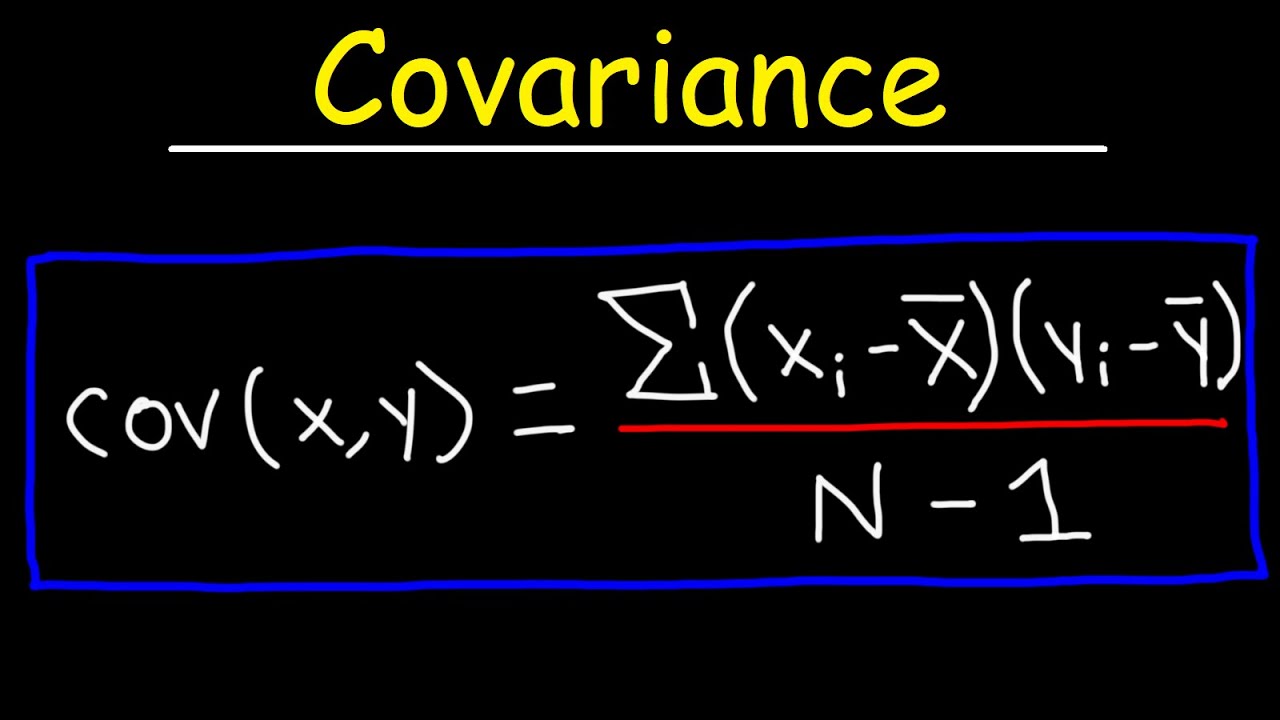
What is the formula for calculating sample covariance?
-The formula for calculating sample covariance is the sum of the products of the deviations of each data point from their respective means, divided by 'n-1', where 'n' is the number of samples.
How does the video use the example of Rising Hills Manufacturing to explain covariance?
-The video uses the example of Rising Hills Manufacturing to illustrate how to calculate covariance by looking at the relationship between the number of workers and the number of tables produced, showing a positive linear relationship as the covariance is positive.
What is the key takeaway from the video regarding the interpretation of covariance?
-The key takeaway is that covariance indicates the direction of the linear relationship between two variables, with a positive value indicating a direct or increasing relationship and a negative value indicating an inverse or decreasing relationship.
Why does the video emphasize the importance of understanding the basic concepts of statistics?
-The video emphasizes the importance of understanding basic concepts because it provides a foundation for grasping more complex topics like correlation and linear regression, and it helps individuals to be better equipped in their studies or work.
Outlines
📚 Introduction to Basic Statistics and Encouragement
The video script begins with a motivational introduction to a series on basic statistics. The speaker encourages viewers who might be struggling in their studies to stay positive, highlighting that seeking help is a sign of intelligence and that overcoming challenges is possible with hard work and patience. The speaker also invites viewers to follow on YouTube and Twitter for updates and to share feedback. The video aims to cover fundamental statistical concepts, starting with an exploration of bivariate relationships and covariance, which are often overshadowed by correlation but are crucial in finance and advanced statistics.
📈 Understanding Bivariate Relationships and Covariance
The speaker introduces the concept of bivariate relationships, focusing on covariance, which measures how two variables change together. Using a real-world example of stock market indices, the S&P 500 and the Dow Jones Industrial Average, the script illustrates a positive linear relationship between the two variables, as they tend to rise and fall together. The speaker explains that covariance is important for understanding the direction of the relationship between variables, with positive covariance indicating a direct relationship and negative indicating an inverse relationship.
📊 The Concept of Covariance and Its Interpretation
This paragraph delves deeper into the concept of covariance, explaining it as a statistical measure that describes the linear association between two variables. The speaker clarifies that covariance is concerned with the direction of the relationship, indicated by a positive or negative value, rather than the strength of the relationship, which is addressed by correlation. The script uses a coordinate plane to illustrate how points in different quadrants relate to the direction of covariance, with positive covariance occurring when both variables move in the same direction and negative when they move in opposite directions.
🔢 The Formula for Sample and Population Covariance
The script provides the formulas for calculating sample and population covariance, explaining the difference in the denominator based on whether the data represents a sample or the entire population. The sample covariance formula is simplified by breaking down the process into steps: subtracting the mean from each data point, multiplying the results, summing them up, and then dividing by the number of samples minus one. The speaker reassures viewers that understanding the formula is not as daunting as it may seem and promises to demonstrate its application through an example.
🛠️ Calculating Covariance with an Example
The speaker presents a practical example to demonstrate the calculation of covariance, using data from Rising Hills Manufacturing on the relationship between the number of workers and the number of tables produced. The process involves calculating the deviations of each data point from their respective means, multiplying these deviations, summing them, and then dividing by the number of samples minus one to find the covariance. The example illustrates a positive covariance, indicating an increasing linear relationship between the number of workers and the tables produced.
🔍 Reviewing Covariance and Its Significance in Statistics
The script concludes with a review of covariance, emphasizing its role as a measure of the direction of the linear relationship between two variables. The speaker reminds viewers that a positive covariance indicates an increasing relationship, while a negative one indicates a decreasing relationship. The speaker also distinguishes covariance from correlation, noting that while covariance provides direction, correlation addresses the strength of the relationship. The video ends with an encouraging message for viewers who may be struggling in their studies, urging them to stay positive and continue learning.
🌟 Final Thoughts and Encouragement for Viewers
In the final paragraph, the speaker reiterates the importance of understanding covariance as a foundation for grasping more complex statistical concepts like correlation and linear regression. The speaker encourages viewers to maintain a positive attitude, share the video, and provide constructive feedback for future content. The script ends on a motivational note, highlighting the value of continuous learning and improvement, and looks forward to the next video in the series.
Mindmap
Keywords
💡Basic Statistics
💡Bivariate Relationships
💡Covariance
💡Correlation
💡Linear Regression
💡Stock Index
💡Positive Linear Relationship
💡Sample Covariance
💡Population Covariance
💡Manufacturing Example
Highlights
Introduction to the video series on basic statistics with encouragement for viewers struggling in class.
Importance of staying positive and the significance of hard work, practice, and patience in overcoming educational challenges.
Invitation to follow the YouTube channel and Twitter for updates on new videos.
Request for feedback through likes, shares, and constructive comments to improve video content.
Explanation of the target audience for the video series, focusing on individuals new to statistics.
Introduction to the concept of bivariate relationships and their significance in statistics.
Clarification of the term 'bivariate' and its relation to the study of relationships between two variables.
Overview of covariance as a foundational concept often overshadowed by correlation.
Importance of covariance in finance and higher-level statistics.
Real-world example of covariance using the S&P 500 and Dow Jones Industrial Average stock indexes.
Description of the positive linear relationship observed in the stock market data.
Explanation of how covariance is calculated and its interpretation in terms of direction and sign.
Distinguishing between sample covariance and population covariance based on the dataset.
Detailed walkthrough of calculating covariance using an example from Rising Hills Manufacturing.
Graphical representation of the relationship between workers and tables produced, illustrating positive covariance.
Review of the conceptual understanding of covariance and its role in linear relationships.
Differentiation between covariance, which indicates direction, and correlation, which indicates strength of relationship.
Encouragement for viewers to stay positive and seek continuous improvement in their studies and work.
Closing remarks and anticipation for the next video in the series.
Transcripts
Browse More Related Video
Statistics 101: Understanding Correlation
How To Calculate The Covariance Between X and Y - Statistics
What is COVARIANCE? What is CORRELATION? Detailed video!

Covariance, Clearly Explained!!!

Covariance and Correlation Explained

Covariance and the regression line | Regression | Probability and Statistics | Khan Academy
5.0 / 5 (0 votes)
Thanks for rating: