Covariance, Clearly Explained!!!
TLDRIn this engaging Stack Quest video, Josh Stormer delves into the concept of covariance, part of a two-part series. He begins by reviewing variance, using the example of mRNA transcripts for gene X in different cells, and then introduces the concept of covariance by considering gene Y transcripts in the same cells. The video explains how covariance can classify three types of relationships: positive trends, negative trends, and no relationship when there is no trend. Josh illustrates how covariance is calculated, emphasizing its role as a stepping stone to correlation, which is not sensitive to the scale of the data. He also discusses the difficulty in interpreting covariance values due to their sensitivity to scale. The video concludes by highlighting the importance of covariance in various analyses, such as principal component analysis (PCA), and teases the next video in the series, which will focus on correlation.
Takeaways
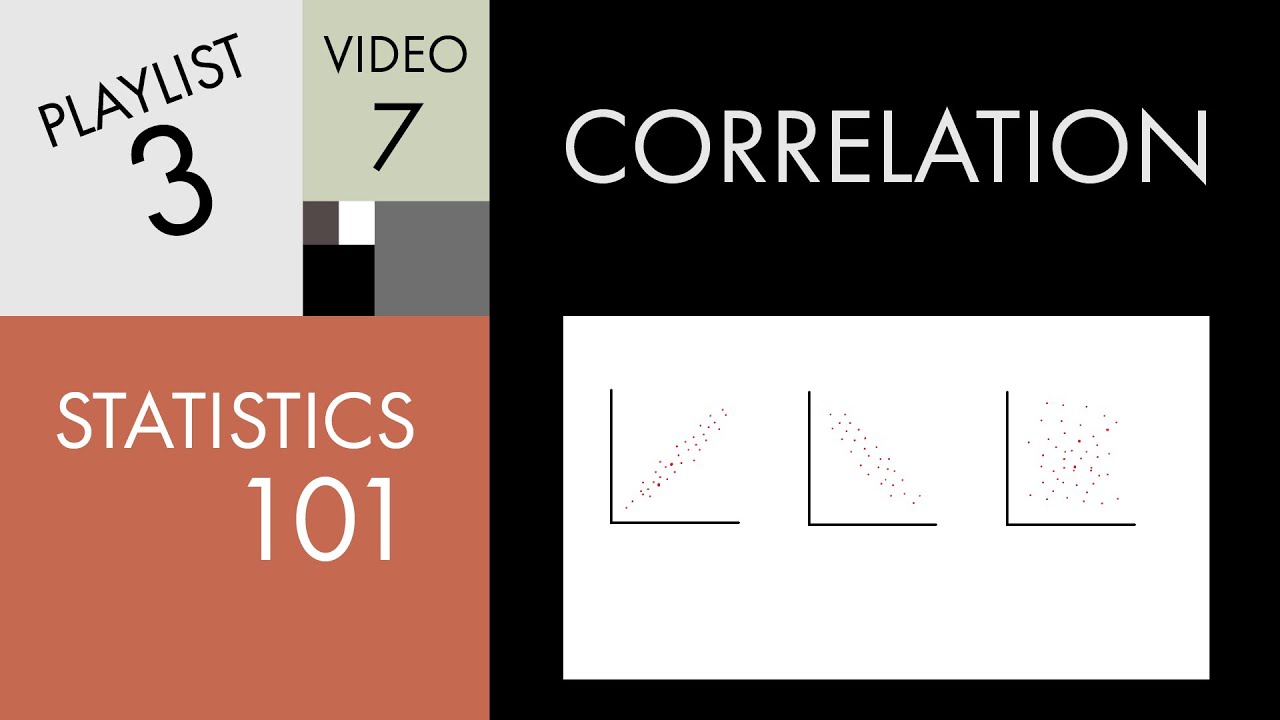
- 📊 **Covariance Basics**: Covariance is a statistical measure that describes the relationship between two variables, indicating whether they move together (positive trend), move in opposite directions (negative trend), or show no trend at all (zero relationship).
- 📈 **Positive Covariance**: When both variables increase or decrease together, the covariance is positive, indicating a positive slope in the relationship between the variables.
- 📉 **Negative Covariance**: If one variable increases while the other decreases, the covariance is negative, suggesting a negative slope in their relationship.
- 🔍 **No Relationship**: A covariance of zero indicates no linear relationship between the variables, as they do not consistently move in the same or opposite directions.
- 🤔 **Interpretation Challenge**: Covariance values are not straightforward to interpret on their own and are sensitive to the scale of the data, which is why they are often used as a step towards calculating correlation.
- 🔗 **Correlation Connection**: Covariance is a stepping stone to correlation, which is a more interpretable measure of the strength and direction of the relationship between two variables.
- 📐 **Graphical Representation**: Covariance can be visualized by plotting each pair of measurements as a dot on a graph, with the overall trend represented by a line that may have a positive or negative slope.
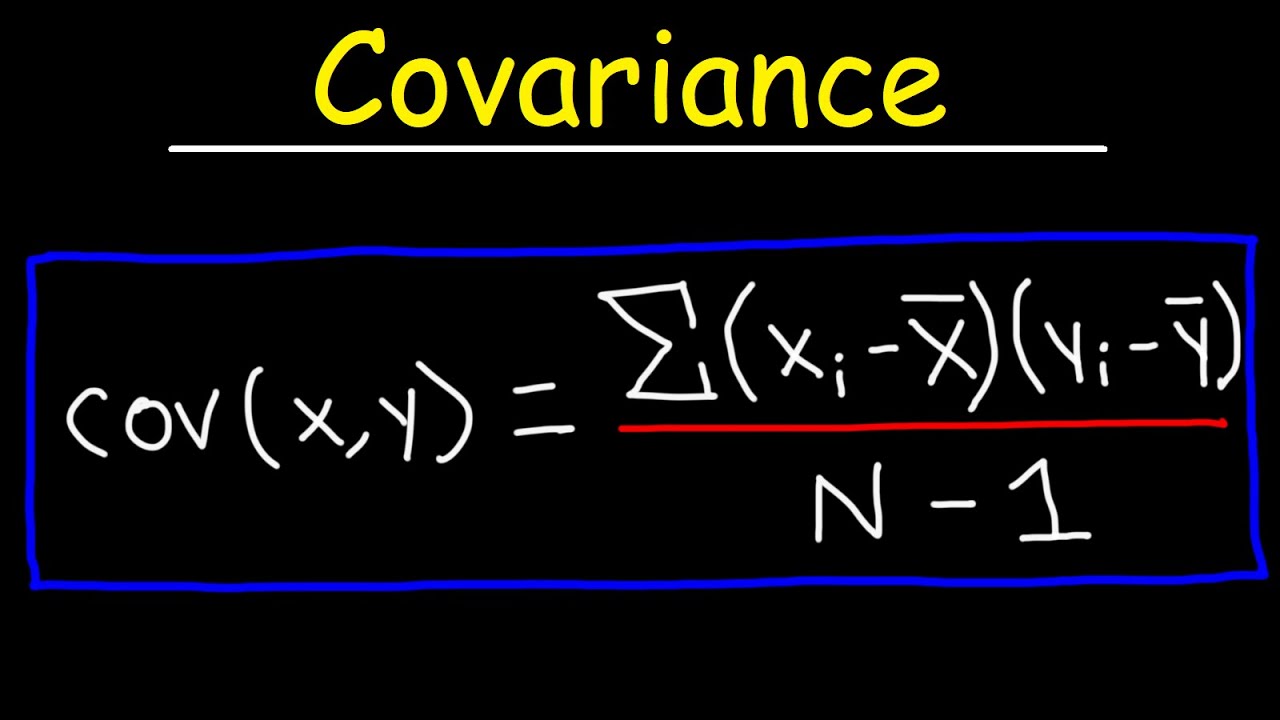
- 🧮 **Calculation Method**: Covariance is calculated by taking the product of the differences from the mean for each variable, summing these products, and then dividing by the number of observations minus one.
- ⚖️ **Scale Sensitivity**: The value of covariance changes with the scale of the data, which is why it is not used directly to assess the strength of a relationship but rather as a precursor to correlation.
- 🔑 **Use in Analysis**: Beyond correlation, covariance values are used in various analyses such as principal component analysis (PCA) and other statistical methods as intermediate steps.
- 📚 **Further Learning**: The concept of variance is a prerequisite for understanding covariance, and further exploration of correlation will provide a more nuanced understanding of these statistical relationships.
Q & A
What is the main topic of discussion in this Stack Quest video?
-The main topic of discussion in this Stack Quest video is covariance and its role as part of a two-part series on the subject.
What is the prerequisite knowledge assumed for understanding the concept of covariance as per the video?
-The video assumes that the viewer is already familiar with the concept of variance.
How does the video use the example of counting mRNA transcripts for gene X and gene Y to explain covariance?
-The video uses the example of counting mRNA transcripts for gene X and gene Y in the same 5 cells to illustrate how covariance can reveal relationships between two sets of measurements taken from the same source.
What does a positive covariance value indicate about the relationship between two variables?
-A positive covariance value indicates that there is a positive trend between the two variables, meaning they tend to increase or decrease together.
What does a negative covariance value suggest about the relationship between gene X and gene Y?
-A negative covariance value suggests that there is a negative trend between gene X and gene Y, meaning as one variable increases, the other tends to decrease.
Why is covariance considered a stepping-stone to correlation?
-Covariance is considered a stepping-stone to correlation because it helps to classify the type of relationship between variables but on its own it is not very interpretable. Correlation, which is derived from covariance, provides a standardized measure that is not sensitive to the scale of the data.
How is the difficulty in interpreting covariance values demonstrated in the video?
-The video demonstrates the difficulty in interpreting covariance values by showing how the covariance between gene X and itself (which is the variance) changes when the scale of the data changes, even though the relationship (the slope of the line) remains the same.
What is the significance of a covariance value of zero in the context of the relationship between two variables?
-A covariance value of zero indicates that there is no linear relationship between the two variables because there is no trend. It suggests that the variables do not change together in a consistent manner.
How does the video use the example of grocery stores to make the concept of covariance more relatable?
-The video uses the example of counting the number of green apples and red apples in the same 5 grocery stores to illustrate the concept of covariance in a real-world scenario, making it easier for viewers to understand the concept by relating it to a familiar context.
What is the role of covariance in statistical analyses such as principal component analysis (PCA)?
-Covariance values are used as stepping stones in various analyses, including PCA, where they help in determining the structure of the data and identifying the principal components.
Why does the video emphasize that covariance values are sensitive to the scale of the data?
-The video emphasizes the sensitivity of covariance values to the scale of the data to explain why covariance values can be difficult to interpret on their own and why they are often used as intermediate steps to calculate more meaningful statistics like correlation.
Outlines
📊 Introduction to Covariance and Correlation
This paragraph introduces the topic of covariance and sets the stage for a two-part series. It begins by reviewing the concept of variance, using the example of mRNA transcripts for gene X in different cells. The video then explores the idea of measuring two variables, gene X and gene Y, within the same cells to examine their relationship. The concept of positive and negative trends and the absence of a relationship is introduced through the graphical representation of their paired measurements. Covariance is presented as a method to quantify whether the measurements taken in pairs provide additional insights compared to individual measurements.
🔍 Understanding Covariance Calculations
This paragraph delves into the calculation of covariance. It explains the process of calculating covariance by using the mean values for two genes, X and Y, and demonstrating how deviations from these means are multiplied together for each data point. The multiplication of differences results in positive values when both gene values are below their respective means and negative values when one gene value is below its mean, and the other is above. The paragraph emphasizes that covariance is a stepping stone to more interesting statistical measures like correlation and that it can classify three types of relationships: positive trends, negative trends, and no relationship due to the absence of a trend.
📈 Positive and Negative Covariance Values
The third paragraph illustrates how to interpret positive and negative covariance values. It explains that a positive covariance value indicates a positive slope in the relationship between the two genes, meaning that when one gene has a high expression level, the other tends to as well. Conversely, a negative covariance value suggests a negative slope, where high expression of one gene corresponds to low expression of the other. The paragraph also demonstrates how the covariance is calculated when the values for one gene are consistently higher or lower than their mean, resulting in positive or negative contributions to the total covariance, respectively.
🔴 Zero Covariance and Its Implications
This section discusses the scenario where the covariance is zero, indicating no trend or relationship between the two genes. It shows that when each value for one gene corresponds to the same value for the other, the covariance calculation results in zero. The paragraph reinforces the idea that covariance values can be difficult to interpret on their own but are essential for further statistical analysis. It also touches upon the concept that even with multiple values for each gene, no trend exists if the values do not consistently increase or decrease together.
🤔 Challenges in Interpreting Covariance
The final paragraph addresses the challenges in interpreting covariance values due to their sensitivity to the scale of the data. It demonstrates that the covariance value can change even when the underlying relationship between the variables does not, by showing an example where the data is multiplied by two, resulting in a different covariance value. The video concludes by highlighting the utility of covariance as a precursor to calculating correlation, which is not sensitive to the scale of the data. It also mentions that covariance values are used in various analyses, such as principal component analysis (PCA), and other computational applications.
Mindmap
Keywords
💡Covariance
💡Correlation
💡Variance
💡Mean
💡Gene X and Gene Y
💡Positive Slope
💡Negative Slope
💡No Relationship/No Trend
💡Principal Component Analysis (PCA)
💡Data Points
💡Scale Sensitivity
Highlights
Covariance is introduced as a statistical concept to measure the relationship between two variables.
The transcript explains covariance through the analogy of counting mRNA transcripts for two genes in the same cells.
Covariance can classify three types of relationships: positive trend, negative trend, and no relationship.
The concept of variance is a prerequisite for understanding covariance, as reviewed in the transcript.
Covariance is calculated by multiplying the differences of each variable from their respective means.
A positive covariance value indicates that both variables increase or decrease together.
A negative covariance value suggests an inverse relationship where one variable increases as the other decreases.
When there is no trend between two variables, the covariance is zero.
Covariance values are difficult to interpret on their own and are used as a stepping stone to calculate correlation.
Correlation is a more interpretable measure of relationship that is not sensitive to the scale of the data.
The transcript uses a visual representation to explain how the sign of the covariance value relates to the slope of the relationship line.
The scale of the data affects covariance values, making them sensitive to changes in scale.
Covariance is a fundamental concept used in various statistical analyses, including principal component analysis (PCA).
The transcript is part of a two-part series, with the second part focusing on correlation.
The speaker, Josh Stormer, uses a conversational and engaging tone to explain complex statistical concepts.
The transcript emphasizes the importance of understanding the limitations of covariance as a statistical tool.
The speaker provides a clear explanation of how to calculate covariance using a step-by-step approach.
The transcript concludes with a call to action for viewers to subscribe for more content and support the channel.
Transcripts
Browse More Related Video

Covariance and Correlation Explained
Statistics 101: Understanding Correlation
How To Calculate The Covariance Between X and Y - Statistics

Statistics 101: Understanding Covariance
What is COVARIANCE? What is CORRELATION? Detailed video!

How To Calculate The Correlation Coefficient Using The Covariance Formula - College Statistics
5.0 / 5 (0 votes)
Thanks for rating: