Covariance and Correlation Explained
TLDRThis video explores the concepts of covariance and correlation between two random variables. It explains how covariance measures the relationship between variables but can be affected by their scales. The correlation coefficient, calculated by dividing covariance by the product of the variables' variances, standardizes the relationship, providing a scale-independent measure that ranges from -1 (perfect negative relationship) to +1 (perfect positive relationship). Examples illustrate these concepts, showing how correlation is unaffected by the scale of measurement.
Takeaways
- 📊 The video discusses covariance and correlation between two random variables, using the example of height and weight to illustrate positive relationships.
- 🔍 Covariance is calculated as the expected value of (X - mean(X)) * (Y - mean(Y)), which indicates the type of relationship between variables but not the strength.
- 🤔 The intuition behind covariance is that if both variables are above or below their means, the covariance can be positive or negative depending on their relative positions.
- 📉 Covariance can be misleading about the strength of a relationship because it is influenced by the scale of the variables involved.
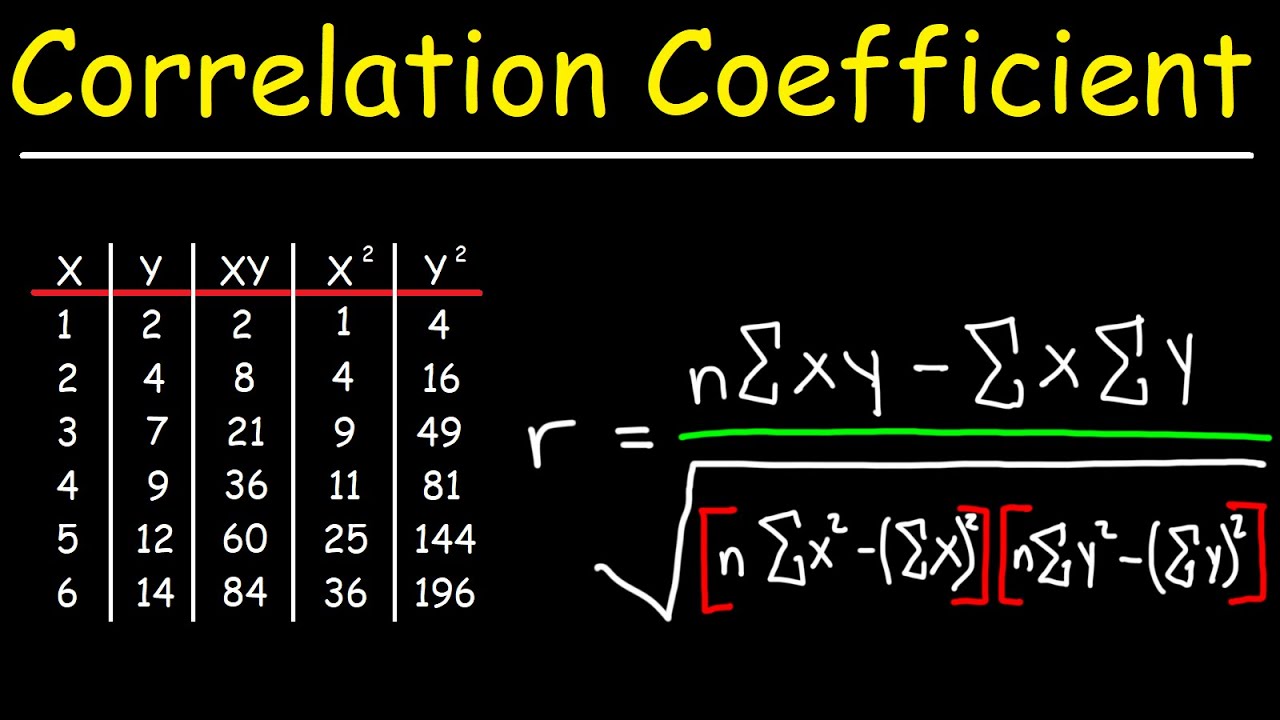
- 📈 Correlation is a standardized measure of the strength of the relationship between two variables, calculated as covariance divided by the product of their standard deviations.
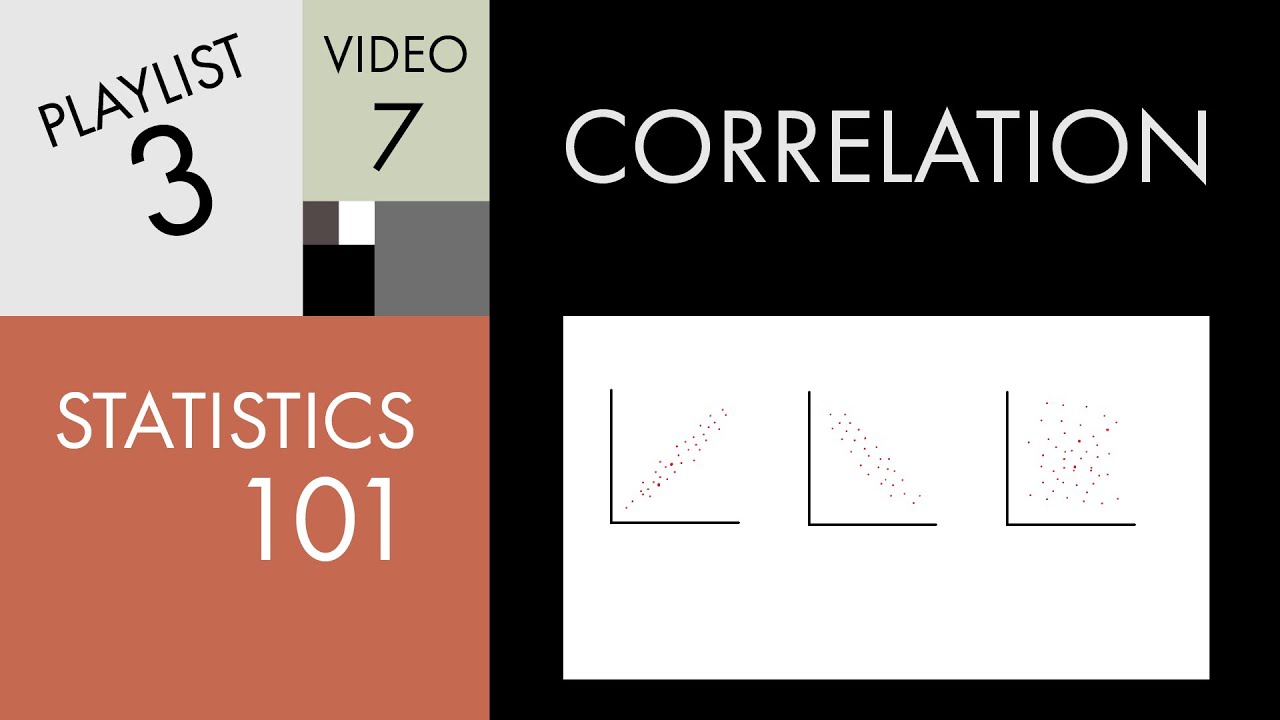
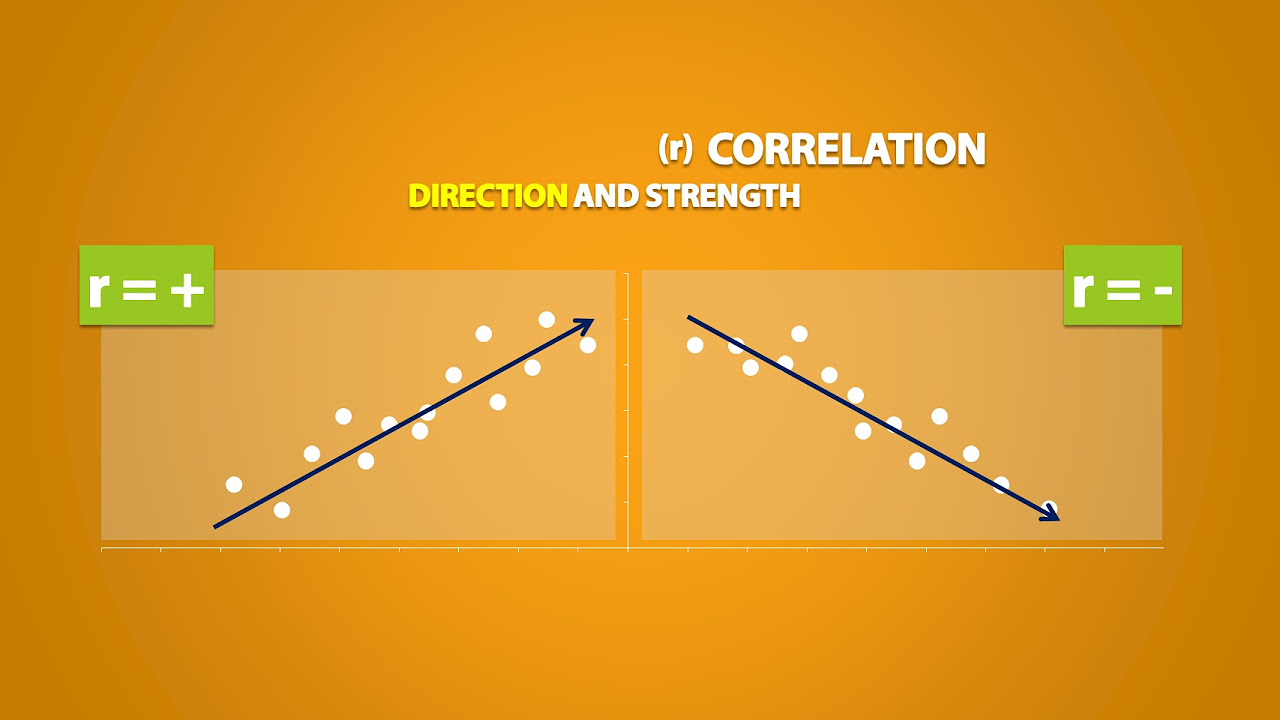
- 🔄 Correlation values range from -1 to +1, with +1 indicating a perfect positive relationship, -1 a perfect negative relationship, and 0 indicating no linear relationship.
- 🌡️ An example given is comparing weight in kilograms versus grams, showing that correlation remains the same regardless of the scale, unlike covariance.
- 💡 The video demonstrates that a strong positive correlation (e.g., 0.922) indicates a close relationship, while a strong negative correlation (close to -1) indicates an inverse relationship.
- 🌡️ Another example is the weak correlation (-0.04) between outdoor temperature and a person's height, suggesting little to no relationship.
- 🧩 The script emphasizes that covariance and correlation are tools to understand the nature and strength of relationships between random variables.
- 👋 The video concludes by encouraging viewers to like, comment, and subscribe for more content on the topic.
Q & A
What is the main topic of the video?
-The main topic of the video is the explanation of covariance and correlation between two random variables.
What is an example of two random variables discussed in the video?
-The example given in the video is the height of a population in centimeters and the weight of that population in kilograms.
What does a positive relationship between two variables indicate in the context of the video?
-A positive relationship indicates that as one variable increases, the other tends to increase as well.
How does the video describe a negative relationship between variables?
-A negative relationship is described as a scenario where an increase in one variable leads to a decrease in the other variable.
What is covariance and how is it mathematically defined in the video?
-Covariance is a measure of how two random variables change together. It is mathematically defined as the expected value of (X - expected value of X) multiplied by (Y - expected value of Y).
What is the intuition behind the covariance formula?
-The intuition behind the covariance formula is that it measures whether two variables move in the same direction (positive covariance) or opposite directions (negative covariance) when deviating from their means.
Why is covariance not the best measure for the strength of a relationship between variables?
-Covariance is not the best measure for the strength of a relationship because it can be influenced by the scale of the variables, making it difficult to compare relationships across different scales.
What is correlation and how does it differ from covariance?
-Correlation is a standardized measure of the strength and direction of the relationship between two variables. It differs from covariance in that it is calculated by dividing the covariance by the product of the standard deviations of the two variables, making it scale-invariant.
What does the range of correlation values indicate about the relationship between variables?
-The range of correlation values, from -1 to +1, indicates the strength and direction of the relationship: +1 for a perfect positive relationship, -1 for a perfect negative relationship, and values close to zero for a weak or no relationship.
How does the video illustrate the effect of changing the scale of measurement on covariance?
-The video illustrates this by hypothesizing that if weight is measured in grams instead of kilograms, the covariance would be a thousand times larger, but this does not mean the relationship is stronger, highlighting the scale-dependency of covariance.
What is the practical implication of using correlation over covariance when analyzing data?
-Using correlation over covariance allows for a more accurate assessment of the strength and direction of the relationship between variables without being affected by the scale of measurement, making it a more reliable indicator for data analysis.
Outlines
📊 Introduction to Covariance and Correlation
This paragraph introduces the concepts of covariance and correlation in the context of two random variables: height and weight of a population. It explains how a positive relationship between these variables can be visualized and quantified using covariance. The formula for covariance is provided, which involves the expected values of the variables. The paragraph also discusses the intuition behind the formula, explaining how positive and negative covariances indicate the direction of the relationship between variables. It clarifies that covariance alone does not indicate the strength of the relationship, which is why correlation is introduced as a standardized measure.
Mindmap
Keywords
💡Covariance
💡Correlation
💡Random Variables
💡Expected Value
💡Positive Relationship
💡Negative Relationship
💡Scale
💡Standard Deviation
💡Variance
💡Linear Relationship
💡No Relationship
Highlights
The video discusses covariance and correlation between two random variables.
An example is given with height and weight of a population showing a positive relationship.
Covariance is introduced as a measure of the relationship between two variables.
Covariance is mathematically defined and its formula is explained.
The intuition behind the covariance formula is discussed in terms of expected values.
Positive and negative covariance scenarios are explained based on the relationship of variables to their means.
Covariance's limitation in indicating the strength of a relationship is highlighted.
Correlation is introduced as a measure to standardize the strength of a relationship between variables.
The formula for calculating correlation is provided.
Correlation is explained to range between -1 and +1, indicating the strength and direction of a relationship.
The scale-independence of correlation is emphasized, contrasting with covariance.
An example of strong positive correlation (0.922) is given.
A strong negative correlation example is provided, showing the relationship between weights and exercise hours.
The concept of measuring covariance and correlation between unrelated variables is discussed.
An example of weak correlation (-0.04) between temperature and height is given to illustrate minimal relationship.
The video concludes by summarizing the purpose of covariance and correlation in understanding variable relationships.
The video encourages viewer engagement through likes and comments.
A call to action for subscription is made to stay updated with channel content.
Transcripts

5.0 / 5 (0 votes)
Thanks for rating: