Covariance and the regression line | Regression | Probability and Statistics | Khan Academy
TLDRThis video script introduces the concept of covariance between two random variables, explaining it as a measure of how much they vary together. It illustrates the idea with examples and connects it to least squares regression, showing how covariance is used to calculate the slope of a regression line. The script also demonstrates how to estimate covariance from a sample and highlights its relationship with variance, providing a deeper understanding of statistical connections.
Takeaways
- 📚 The video introduces the concept of covariance between two random variables, which measures how much they vary together.
- 📉 Covariance is defined as the expected value of the product of the differences of each random variable from their respective means.
- 🔍 The script uses an example to illustrate covariance, showing how a single data point's deviation from the mean can indicate the relationship between variables.
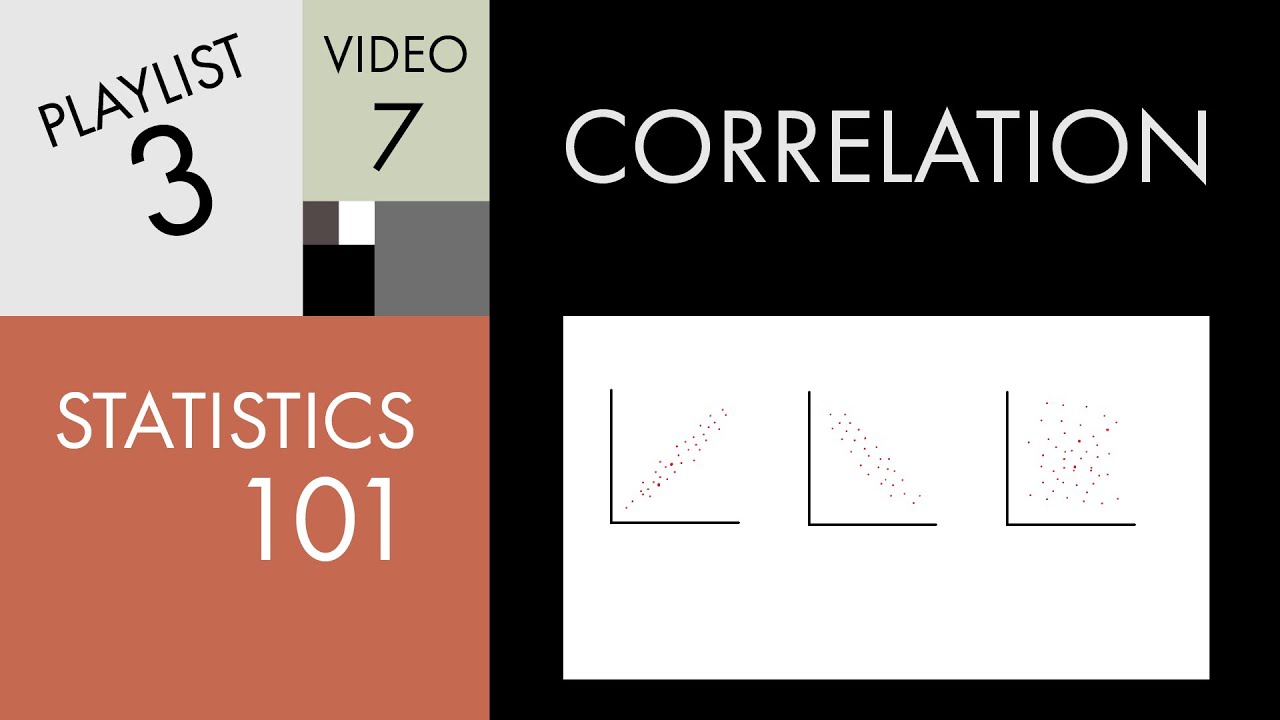
- 📈 The video explains that if one variable increases when the other decreases, the covariance is negative, and vice versa for a positive covariance.
- 🔢 The magnitude of covariance indicates the degree to which the variables move together, with larger values showing stronger relationships.
- 📝 The script demonstrates algebraic manipulation of the covariance formula, showing its equivalence to the expected value of the product of the variables minus the product of their means.
- 🔬 The video connects the concept of covariance to least squares regression, emphasizing the mathematical relationship between the two.
- 📊 The script shows that the covariance can be approximated using sample means, specifically the sample mean of the product of X and Y minus the product of the sample means of X and Y.
- 📐 The formula for the slope of a regression line is derived from the covariance concept, highlighting the practical application of covariance in statistical analysis.
- 📉 The slope of the regression line can be seen as the covariance of the two variables divided by the variance of the independent variable.
- 🧠 The video aims to provide a deeper understanding of covariance and its relevance in various statistical contexts, emphasizing the interconnectedness of statistical concepts.
Q & A
What is the covariance between two random variables?
-Covariance is a measure of how two random variables change together. It's defined as the expected value of the product of the deviations of each random variable from their respective means.
How does the sign of covariance indicate the relationship between two variables?
-A positive covariance indicates that both variables tend to increase or decrease together, while a negative covariance suggests that as one variable increases, the other tends to decrease.
What is the formula for covariance in terms of expected values?
-The formula for covariance is given by E[(X - E[X])(Y - E[Y])], where E[X] and E[Y] are the expected values (means) of the random variables X and Y, respectively.
Can you explain the concept of expected value in the context of covariance?
-The expected value, or mean, of a random variable is the long-term average value that the variable takes. In the context of covariance, it represents the average deviation of the variables from their means.
How is covariance related to the concept of variance?
-The covariance of a random variable with itself is equal to the variance of that variable. Variance measures the spread of a single variable, while covariance measures the joint variability of two variables.
What is the connection between covariance and least squares regression?
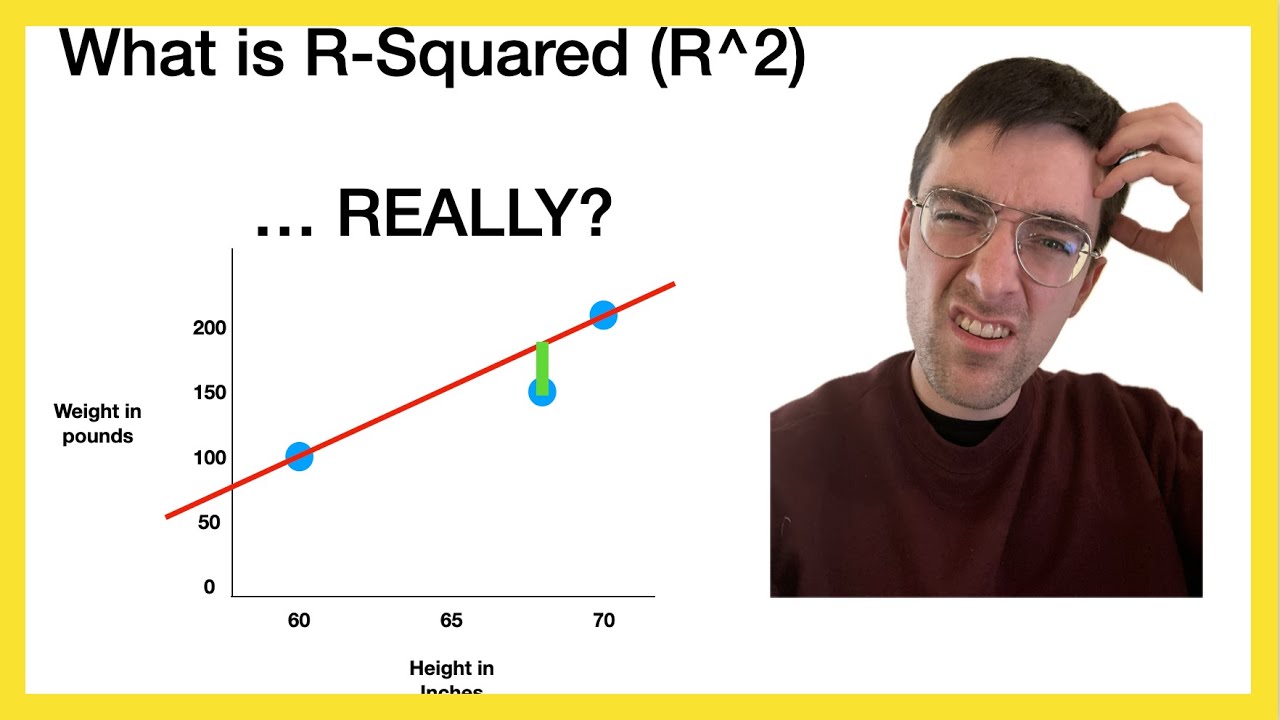
-The slope of the least squares regression line can be found using the formula that involves the covariance of the two variables and the variance of the independent variable. It shows how the dependent variable is expected to change with the independent variable.
How can you estimate covariance from a sample of data?
-Covariance can be estimated by calculating the sample mean of the products of the paired data points, minus the product of the sample means of the individual variables.
What does it mean if the covariance between two variables is zero?
-A covariance of zero indicates that there is no linear relationship between the two variables. They do not change together in a systematic way.
Can you provide an example of how to calculate covariance using a sample of data?
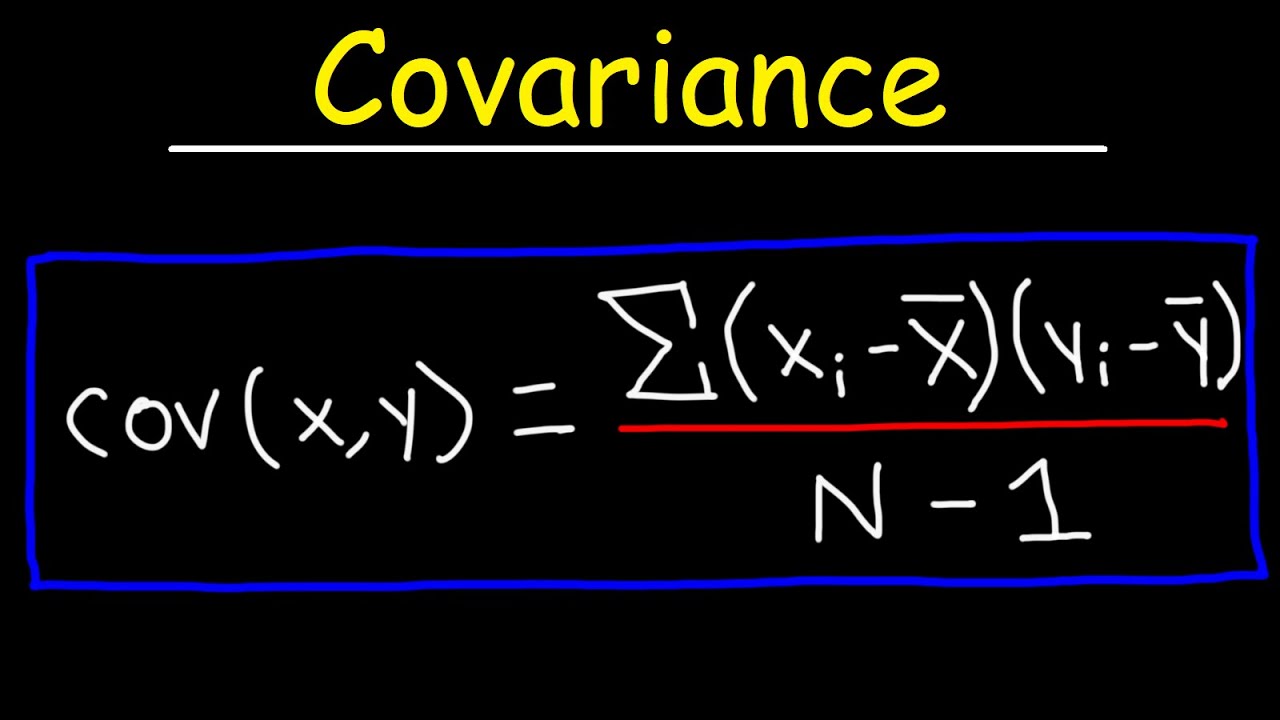
-To calculate covariance from a sample, you would take the sum of the products of each paired data point (xi * yi), subtract the product of the sample means (mean_x * mean_y), and then divide by the number of data points minus one.
How does the magnitude of covariance relate to the strength of the relationship between two variables?
-The magnitude of covariance indicates the strength of the linear relationship between two variables. A larger absolute value suggests a stronger relationship, while a smaller value indicates a weaker relationship.
What is the difference between population covariance and sample covariance?
-Population covariance is calculated using the entire population data and does not have the divisor (n-1), whereas sample covariance is an estimate from a sample of the population and is divided by (n-1), where n is the sample size.
Outlines
📚 Introduction to Covariance
The speaker begins by introducing the concept of covariance between two random variables, explaining it as the expected value of the product of the distances of each variable from their respective means. This is illustrated by writing down the formula and providing an example with hypothetical data points. The explanation emphasizes how covariance measures the degree to which two variables vary together, either positively or negatively, and how this can be intuitively understood by considering individual data points and their relationship to the means of the variables involved.
🔍 Deep Dive into Covariance Formula
This paragraph delves deeper into the mathematical formulation of covariance. The speaker rewrites the covariance formula, explaining the distributive property and how to simplify the expression. The explanation includes the concept of expected values and how they relate to arithmetic means or probability-weighted sums. The speaker also clarifies the properties of expected values, such as the expected value of an expected value being the same as the expected value itself, and uses this to simplify the covariance formula further, leading to a clearer understanding of its components.
📈 Covariance and Sample Estimation
The speaker discusses how to estimate covariance from a sample of data points. They explain that the expected values in the covariance formula can be approximated by the sample means of the variables and their products. This leads to a formula that is reminiscent of the one used to calculate the slope of a regression line. The paragraph highlights the connection between covariance and regression analysis, showing how the numerator of the slope formula is essentially an estimate of the covariance between the variables.
🤝 Connecting Covariance with Regression
In this final paragraph, the speaker makes explicit the connection between covariance and regression analysis. They show that the slope of a regression line can be expressed as the covariance of the variables divided by the variance of the independent variable. This insight reveals the fundamental role of covariance in understanding the relationship between variables in a regression model. The speaker also touches on the concept of variance and how it relates to the covariance of a variable with itself, reinforcing the statistical interrelations discussed throughout the video script.
Mindmap
Keywords
💡Covariance
💡Expected Value
💡Random Variables
💡Deviation
💡Population Mean
💡Variance
💡Least Squares Regression
💡Slope of the Regression Line
💡Sample Mean
💡Distributive Property
💡Estimation
Highlights
Introduction to the concept of covariance between two random variables.
Covariance is defined as the expected value of the product of the distances of each variable from their mean.
Covariance measures how much two variables vary together.
An example is given where X is above its mean when Y is below its mean, illustrating negative covariance.
The concept of covariance is connected to least squares regression.
Covariance is rewritten using the distributive property to show its relationship with expected values.
The expected value of the sum or difference of random variables is the sum or difference of their expected values.
The expected value of a constant is the constant itself, simplifying the expression for covariance.
Covariance formula is simplified to expected value of XY minus the product of expected values of X and Y.
Estimation of covariance from a sample is discussed, relating to the sample mean of products and individual means.
The formula for covariance is shown to be closely related to the slope calculation in regression analysis.
The numerator used for calculating the slope of the regression line is the same as the covariance estimate.
The slope of the regression line is expressed as the covariance of X and Y over the variance of X.
Covariance of a variable with itself is the variance of that variable, providing a deeper understanding of regression slope.
The video aims to demonstrate the interconnectedness of statistical concepts and their practical applications.
The covariance is a fundamental concept that helps in understanding the relationship between variables in statistics.
The transcript provides a clear explanation of how covariance is derived and its significance in regression analysis.
Transcripts


5.0 / 5 (0 votes)
Thanks for rating: