Estimating limits from tables | Limits and continuity | AP Calculus AB | Khan Academy
TLDRThe video script discusses the concept of limits in the context of a function g defined over the real numbers. It uses a table of select values to estimate the limit of g(x) as x approaches 5. The analysis focuses on the behavior of g(x) from both sides of 5, noting that g(x) seems to approach 3.68 whether coming from values less than or greater than 5. Despite g(5) being 6.37, the limit is inferred to be 3.68. The script illustrates that the limit does not necessarily equal the function's value at that point, and a graph is drawn to visualize the function's behavior near x=5.
Takeaways
- 📈 The function g is defined over the real numbers with a given table of select values.
- 🔍 The task is to estimate the limit of g(x) as x approaches 5, using the provided data points.
- 👓 When approaching 5 from values less than 5, g(x) seems to approach 3.68, as seen at x=4.999.
- 🔄 At x=5, g(x) jumps to 6.37, indicating a discontinuity or a behavior that's not reflective of the limit.
- 📊 The value of g(5) is 6.37, but this does not determine the limit as the function's behavior at a point is distinct from the limit.
- 🤔 The limit of g(x) as x approaches 5 is most reasonably estimated to be 3.68, despite the jump at x=5.
- 📌 The concept of limit focuses on the trend or behavior as x gets closer to a certain value, not the value of the function at that point.
- 📐 A graph can be inferred from the data, showing g(x) approaching 3.68 from both sides of 5, with a spike at x=5.
- 🧠 Understanding the concept of limits is crucial for grasping the behavior of functions at specific points without necessarily evaluating the function there.
- 🌟 The key takeaway is that the limit of a function at a point is the value the function approaches from the left and right, not the function's value at that point.
Q & A
What is the main topic of the video script?
-The main topic of the video script is to estimate the limit of a function g as x approaches 5, using a given table of select values of g(x).
How does the table provide information about the function g?
-The table provides information about the function g by giving specific x values and their corresponding g(x) values, including the value at x equals five.
What is the observed behavior of g(x) as x approaches 5 from values less than 5?
-As x approaches 5 from values less than 5, g(x) appears to be approaching a value close to 3.68, as seen with the value at x equals 4.999 being 3.68.
What is the observed behavior of g(x) as x approaches 5 from values greater than 5?
-As x approaches 5 from values greater than 5, g(x) also appears to be approaching the same value of 3.68, as seen with the value at x equals 5.001 still being 3.68.
What is the value of g(x) at x equals 5 according to the table?
-According to the table, the value of g(x) at x equals 5 is 6.37.
Why does the limit of g(x) as x approaches 5 not necessarily have to be the same as g(5)?
-The limit of a function as x approaches a certain point does not have to be the same as the function's value at that point. The limit represents the value the function approaches from the left and right, which may differ from the value at that point itself.
What is the reasonable estimate for the limit of g(x) as x approaches 5 based on the script?
-The reasonable estimate for the limit of g(x) as x approaches 5, based on the script, is 3.68, as the function appears to be approaching this value from both less than and greater than 5.
How does the teacher illustrate the concept of the limit in the video?
-The teacher illustrates the concept of the limit by discussing the behavior of the function g(x) as it approaches x=5 from both directions and by drawing a graph to represent the function's behavior near x=5.
What is the significance of the value 3.68 in the context of the video?
-The value 3.68 is significant because it is the estimated limit of the function g(x) as x approaches 5 from both directions, despite the function's actual value at x=5 being 6.37.
How does the script demonstrate the concept that the function's value at a point is different from the limit of the function at that point?
-The script demonstrates this concept by showing that while g(5) is 6.37, the limit of g(x) as x approaches 5 is estimated to be 3.68, highlighting that the function's value at a point does not necessarily match its limit.
What is the role of the table in helping understand the limit of g(x) as x approaches 5?
-The table plays a crucial role by providing select values of g(x) that allow us to observe the behavior of the function as x gets closer to 5. This observation helps us make an informed estimate about the limit.
Outlines
📚 Estimating Limits of a Function
The paragraph discusses the process of estimating the limit of a function g as x approaches 5, using a table of select values. The teacher guides the viewer to analyze the behavior of g(x) from both sides of 5, noting that the function's value at x=5 is 6.37, but the limit appears to be 3.68. The key points include understanding that the limit does not necessarily equal the function's value at that point and inferring the function's graph behavior from the given data points.
Mindmap
Keywords
💡limit
💡real numbers
💡table
💡approaching
💡values less than five
💡values greater than five
💡function
💡inference
💡sample points
💡graph
💡value of the function
Highlights
The function g is defined over the real numbers, and the task is to estimate the limit of g(x) as x approaches 5.
A table of select values of g(x) is provided to aid in estimating the limit.
The x values approach five from both less than five and greater than five, providing a two-sided estimate.
At x equals four, g(x) is approximately 3.37, showing a pattern as x approaches five from the left.
When x is very close to five (a thousandth away), g(x) is 3.68, indicating a value approaching five from the left.
At x equals five, g(x) jumps to 6.37, which is a significant change from the value as x approaches five.
Approaching five from the right, at x equals six, g(x) is 3.97, showing a different pattern.
For values just greater than five, g(x) at 5.1 is 3.84 and at 5.01 is 3.7, maintaining the pattern observed from the right.
The limit from both sides approaches 3.68, despite the value at x equals five being 6.37.
The concept that the limit does not have to match the function's value at that point is a key takeaway.
A visual representation of the function's behavior near x equals five is attempted through a sketch.
The graph might look like it's approaching 3.68 from both sides, with a sudden jump at x equals five.
The function's value at x equals five is contrasted with the limit as x approaches five.
The process of estimating the limit involves making inferences from sample points of the function.
The discussion emphasizes the importance of understanding the concept of limits in calculus.
The example serves as a practical application of limit estimation, showcasing the method's utility in function analysis.
The transcript provides a clear and detailed explanation of how to estimate the limit of a function at a specific point.
The approach to estimating the limit from both sides of the value is highlighted as a crucial step.
The transcript underscores the need to differentiate between the function's value at a point and the limit as that point is approached.
Transcripts
Browse More Related Video
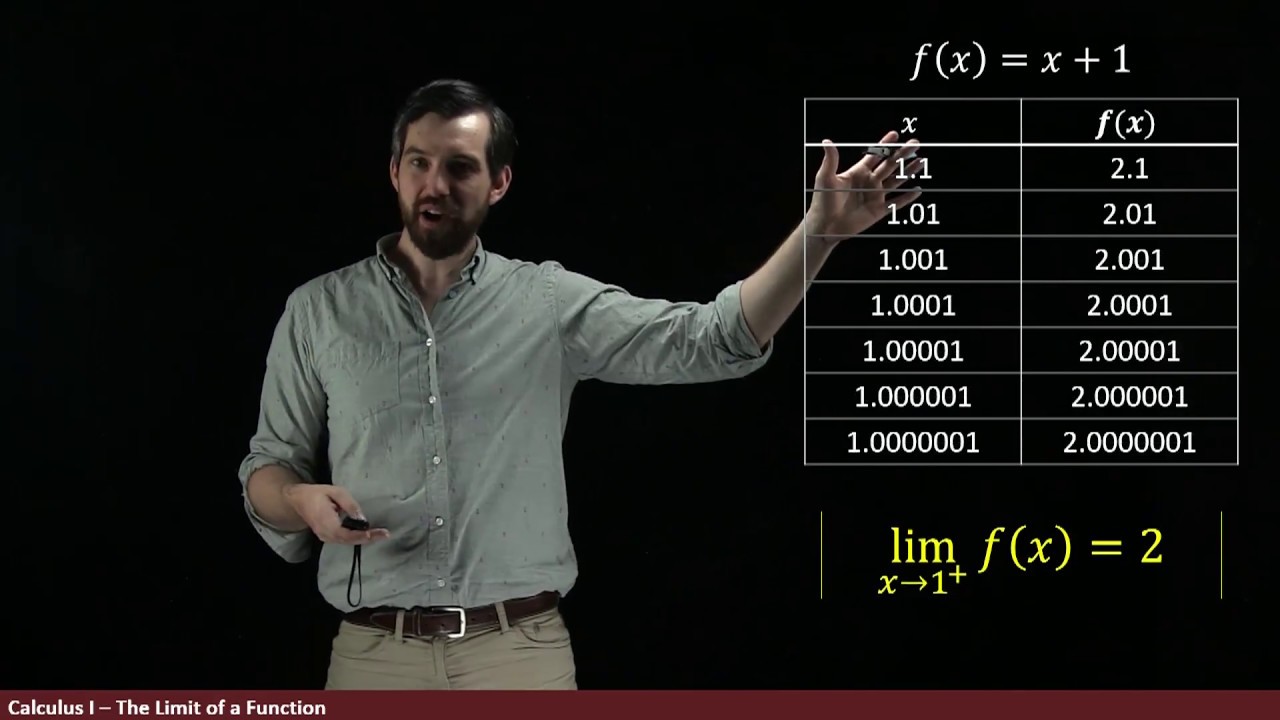
A Tale of Three Functions | Intro to Limits Part II
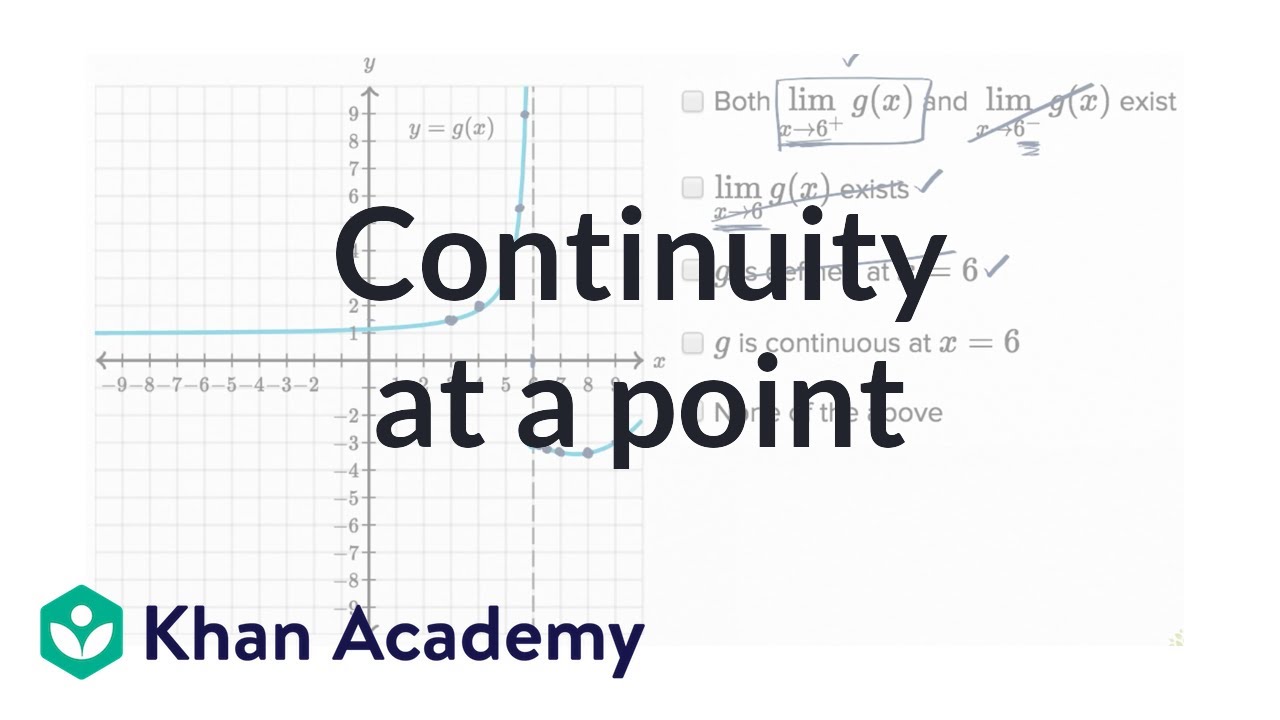
Worked example: Continuity at a point | Limits and continuity | AP Calculus AB | Khan Academy
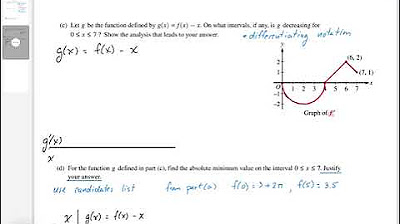
AP CALCULUS AB 2022 Exam Full Solution FRQ#3(c,d)
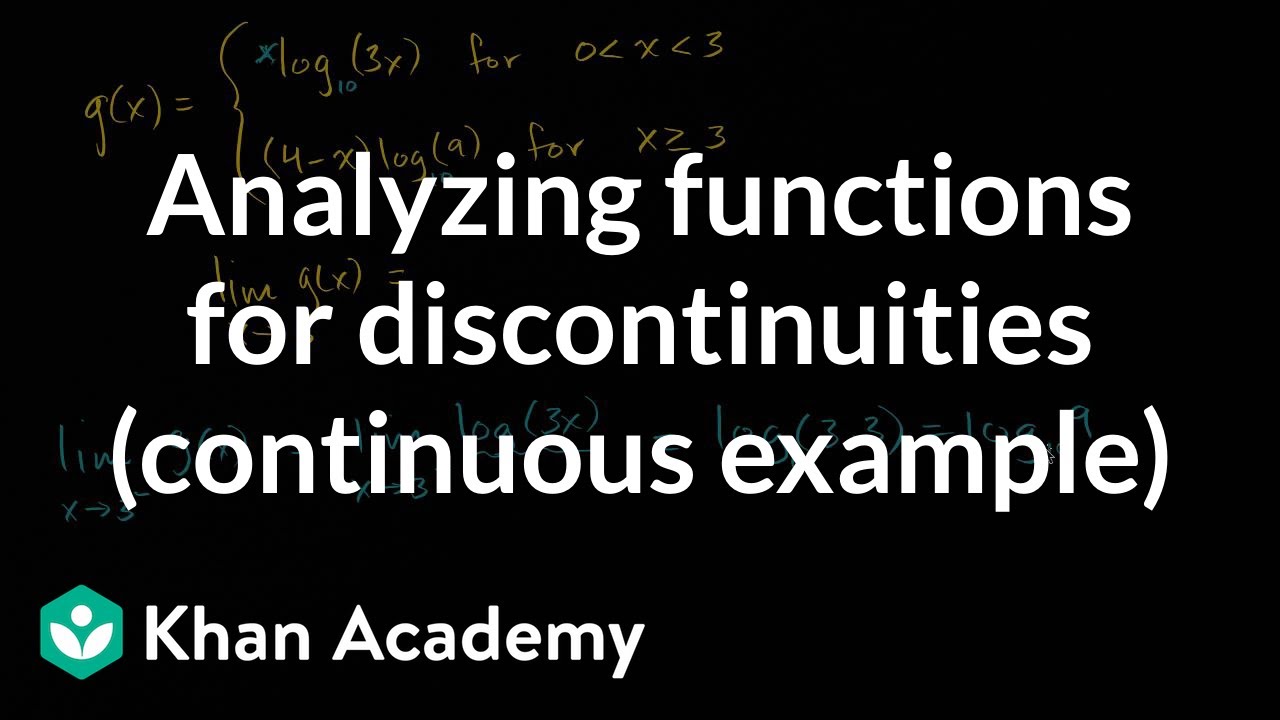
Analyzing functions for discontinuities (continuous example) | AP Calculus AB | Khan Academy

Introduction to The Limit
Fancy algebra to find a limit and make a function continuous | Differential Calculus | Khan Academy
5.0 / 5 (0 votes)
Thanks for rating: