8.1.3 Basics of Hypothesis Testing - Computing and Interpreting Test Statistics
TLDRThis video script offers an in-depth exploration of hypothesis testing, focusing on computing test statistics for sample proportions, means, and standard deviations. It outlines the process of hypothesis testing, from formulating null and alternative hypotheses to graphing sampling distributions and determining the significance of sample statistics. The script explains the use of z-scores, t-scores, and chi-squared values for different scenarios, emphasizing the importance of understanding the underlying concepts and the application of appropriate formulas to assess the rarity of observed sample statistics.
Takeaways
- 📝 The video discusses computing test statistics for hypothesis testing, focusing on sample proportions, means, and standard deviations.
- 🔍 The process begins with writing the claim symbolically to determine if there is evidence supporting the claim as true or false.
- 🧠 Hypotheses are defined as null (H0) and alternative (H1), based on the claim, to guide the statistical analysis.
- 📊 A sampling distribution of the sample statistic is graphed under the assumption that the null hypothesis is true, providing a basis for comparison.
- 📉 The sample statistic is compared to the mean of the sampling distribution to determine if it is significantly high or low.
- 📚 The test statistic is computed to standardize the sample statistic, allowing for the use of known distributions like z-scores, t-scores, or chi-squared values.
- ⚖️ The decision to reject the null hypothesis is based on whether the sample statistic is an extreme value relative to a predetermined significance level.
- 📉 For sample proportions, a z-score is used to standardize the distribution, assuming the population proportion and using the formula involving p-hat, p, q, and n.
- 📊 When the population standard deviation is unknown, the sampling distribution of sample means is approximated by a t-distribution, using a t-score as the test statistic.
- 📐 If the population standard deviation is known, or the sample size is large, z-scores are used instead of t-scores for sample means.
- 📘 The chi-squared distribution is used for sample standard deviations or variances, with a specific formula to convert to this distribution when the original population is normally distributed.
Q & A
What are the three main test statistics discussed in the video?
-The three main test statistics discussed in the video are for sample proportions, sample means, and sample standard deviations.
What is the basic procedure for hypothesis testing as outlined in the video?
-The basic procedure for hypothesis testing includes writing the claim in symbolic form, inferring the null and alternative hypotheses, identifying or computing the sample statistic, graphing a sampling distribution of the sample statistic assuming the null hypothesis is true, determining if the sample statistic is significantly high or low, computing a test statistic, and making a decision about the null hypothesis.
What is the condition for using a normal distribution to approximate the sampling distribution of a sample proportion?
-The condition for using a normal distribution to approximate the sampling distribution of a sample proportion is that both np and nq are greater than or equal to five, where n is the sample size, and p and q are the probability of success and failure, respectively.
How is the test statistic for a sample proportion calculated?
-The test statistic for a sample proportion is calculated using the formula Z = (p̂ - p) / √(p(1-p) / n), where p̂ is the sample proportion, p is the population proportion, and n is the sample size.
What is the difference between the sampling distribution of sample means when the population standard deviation is known and when it is unknown?
-When the population standard deviation is known and the sample size is large enough, the sampling distribution of sample means is approximated by a standard normal distribution using z-scores. When it is unknown, the sampling distribution is approximated by a student t-distribution using t-scores.
What is the formula for the test statistic when the population standard deviation is known and the sample size is greater than 30?
-The formula for the test statistic when the population standard deviation is known and the sample size is greater than 30 is Z = (x̄ - μ) / (σ / √n), where x̄ is the sample mean, μ is the population mean, σ is the population standard deviation, and n is the sample size.
What is the significance of computing a test statistic?
-Computing a test statistic is significant because it allows us to determine if the sample statistic is an extreme value, which can help us decide whether to reject the null hypothesis based on whether the test statistic corresponds to a rare event under the assumed distribution.
What is the role of the critical value method and p-value method in hypothesis testing?
-The critical value method and p-value method are two different approaches to decide whether the sample statistic is an extreme value. The critical value method involves comparing the test statistic to a critical value, while the p-value method involves comparing it to a probability threshold.
What is the assumption made when graphing the sampling distribution of a sample statistic under the null hypothesis?
-The assumption made when graphing the sampling distribution of a sample statistic under the null hypothesis is that the null hypothesis is true, which typically gives us the mean of that sampling distribution.
How does the video script illustrate the process of hypothesis testing using an example with sample proportions?
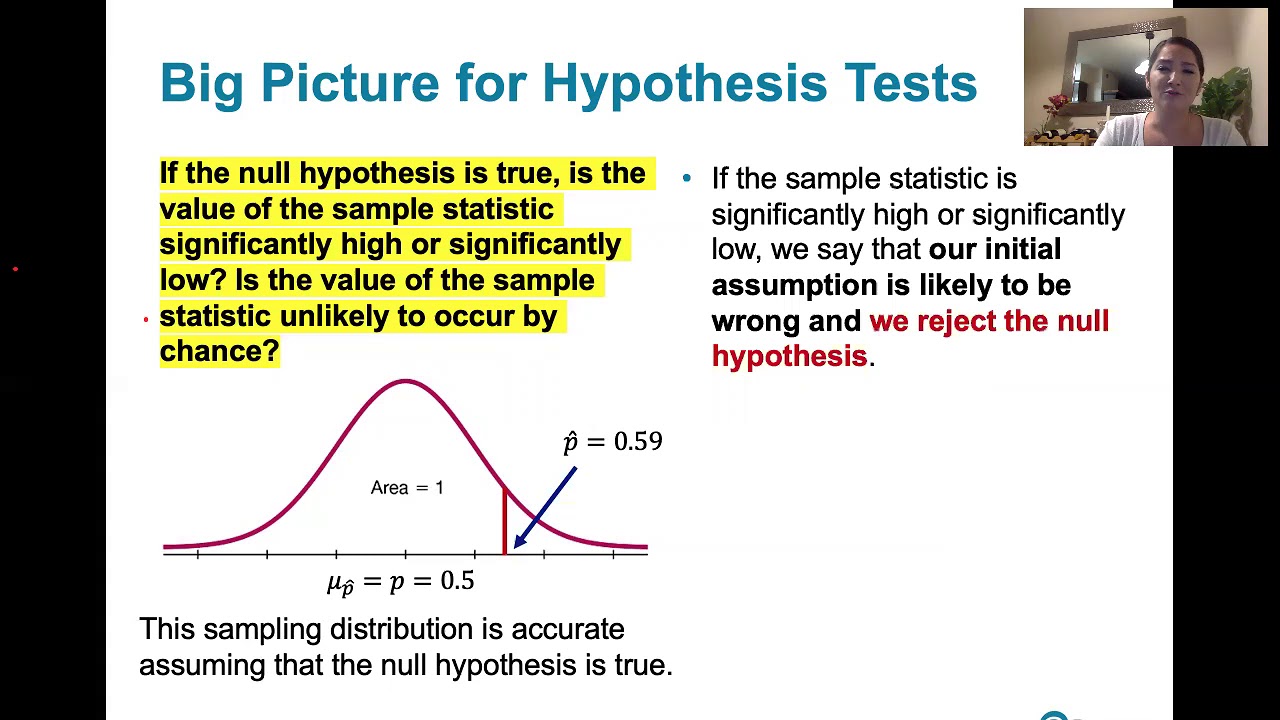
-The script uses an example of a survey where 59 out of 565 adults would erase all their personal information online if they could. It demonstrates the process of hypothesis testing by stating the null and alternative hypotheses, computing the sample proportion, graphing the sampling distribution, calculating the test statistic (z-score), and discussing the implications of the result.
Outlines
📊 Understanding Hypothesis Testing and Test Statistics
This video covers learning outcome number three from lesson 8.1, focusing on computing test statistics for sample proportions, means, and standard deviations. It explains the appropriate formulas for each, the basic procedure for hypothesis testing, including writing claims in symbolic form, determining null and alternative hypotheses, identifying or computing sample statistics, and graphing sampling distributions. The process involves checking if a sample statistic is significantly high or low under the null hypothesis, using test statistics like z-scores or t-scores to make conclusions.
🔢 Sampling Distributions and Population Proportions
This section explains the different test statistics based on the sampling distribution of the corresponding sample statistic. It emphasizes the importance of sampling distributions in testing claims about population proportions, means, and standard deviations. The population proportion is tested by looking at the sampling distribution of the sample proportion, often approximated by a normal distribution under certain conditions. The process involves converting non-standard distributions to standard ones for probability calculations.
📐 Student t-Distribution for Sample Means
This paragraph discusses the use of the student t-distribution when the sample size is small or the population standard deviation is unknown. It explains the similarity to the normal distribution but with a greater standard deviation, necessitating conversion from x-bar to t-scores. The student t-distribution approximates the normal distribution as the sample size increases. It also mentions that if the population standard deviation is known, z-scores can be used instead.
📏 Chi-Squared Distribution for Sample Standard Deviations
This part introduces the chi-squared distribution used for sample standard deviations and variances. It briefly covers the formula for converting sample standard deviations to the chi-squared distribution, which requires the original population to be normally distributed. The chi-squared distribution has a different shape compared to normal distributions, being skewed. It explains how to use this distribution to find probabilities for hypothesis testing.
📈 Practical Example of Computing Test Statistics
This paragraph provides a practical example using a survey about personal data online to compute a test statistic for a sample proportion. It walks through identifying the sample proportion and population size, stating null and alternative hypotheses, and graphing the sampling distribution. The example illustrates converting a sample proportion to a z-score and interpreting its extremeness to determine if the null hypothesis should be rejected.
🧮 Summary and Next Steps in Hypothesis Testing
The final paragraph recaps the methods for computing test statistics for sample proportions, means, and standard deviations using z-scores, t-scores, and chi-squared distributions. It emphasizes understanding the formulas and their representations related to sampling distributions. It concludes with a preview of the next video, which will cover testing a claim using the critical value method, building on the tools and concepts discussed in this video.
Mindmap
Keywords
💡Sample Proportion
💡Sample Mean
💡Sample Standard Deviation
💡Null Hypothesis
💡Alternative Hypothesis
💡Test Statistic
💡Z-Score
💡T-Score
💡Chi-Squared Distribution
💡Sampling Distribution
Highlights
Introduction to computing test statistics for sample proportions, means, and standard deviations.
Procedure for hypothesis testing: writing claims in symbolic form, inferring null and alternative hypotheses.
Graphing the sampling distribution of the sample statistic and labeling the mean and sample statistic.
Determining if the sample statistic is significantly high or low, relative to the null hypothesis.
Converting non-standard distributions to standard ones using formulas for test statistics.
Using z-scores, t-scores, and chi-squared values to find probabilities and test statistics.
Test statistic computation methods: critical value method and p-value method.
Stating conclusions in non-technical terms after computing test statistics.
Understanding sampling distributions of sample proportions and their approximations.
Conditions for using normal distribution approximations for sample proportions.
Using formulas to convert from sample proportions to z-scores.
Distinguishing between normal and student t distributions for sample means.
Using student t distribution when the population standard deviation is unknown.
Chi-squared distribution for sample standard deviations and its requirements.
Example of computing test statistics for a given sample proportion.
Importance of understanding formulas and their application to hypothesis testing.
Introduction to the critical value method for hypothesis testing in the next video.
Transcripts
Browse More Related Video

AP Statistics Unit 6 Summary Review Inference for Proportions Part 2 Significance Tests

Elementary Statistics - Chapter 9 - Inferences from Two Samples
8.1.2 Basics of Hypothesis Testing - Significance Level, Type I and Type II Error
Test Statistics: Crash Course Statistics #26
Math 119 Chapter 9 part 1
Hypothesis Testing - Solving Problems With Proportions
5.0 / 5 (0 votes)
Thanks for rating: