Hypothesis testing (ALL YOU NEED TO KNOW!)
TLDRThis video script offers an in-depth exploration of hypothesis testing in statistical inference, led by Justin Zeltser. It begins with an intuitive understanding, moves through the foundational concepts of null and alternative hypotheses, significance levels, and test statistics, and culminates in a detailed discussion on p-values and confidence intervals. The script uses a medical treatment example to illustrate these concepts, further delving into power analysis and sample size calculations, providing a comprehensive guide suitable for learners new to the topic or seeking a refresher.
Takeaways
- 📚 The video is the third in a series on statistical inference, focusing on hypothesis testing, presented by Justin Zeltser.
- 🎯 Hypothesis testing is introduced with an emphasis on intuition before diving into numerical examples, aiming to provide a comprehensive understanding.
- 🔍 The video begins with a conceptual explanation of hypothesis testing, using the example of a potentially biased coin to illustrate the process.
- ⚖️ The script explains the importance of the null hypothesis, which assumes no effect or difference, and the alternate hypothesis, which suggests an effect or difference.
- 📉 The concept of a test statistic and its accompanying p-value are introduced, with the p-value described as a measure of the extremity of the sample.
- 📊 The video discusses confidence intervals as a complementary tool to p-values, offering a different perspective based on the sample rather than the null hypothesis.
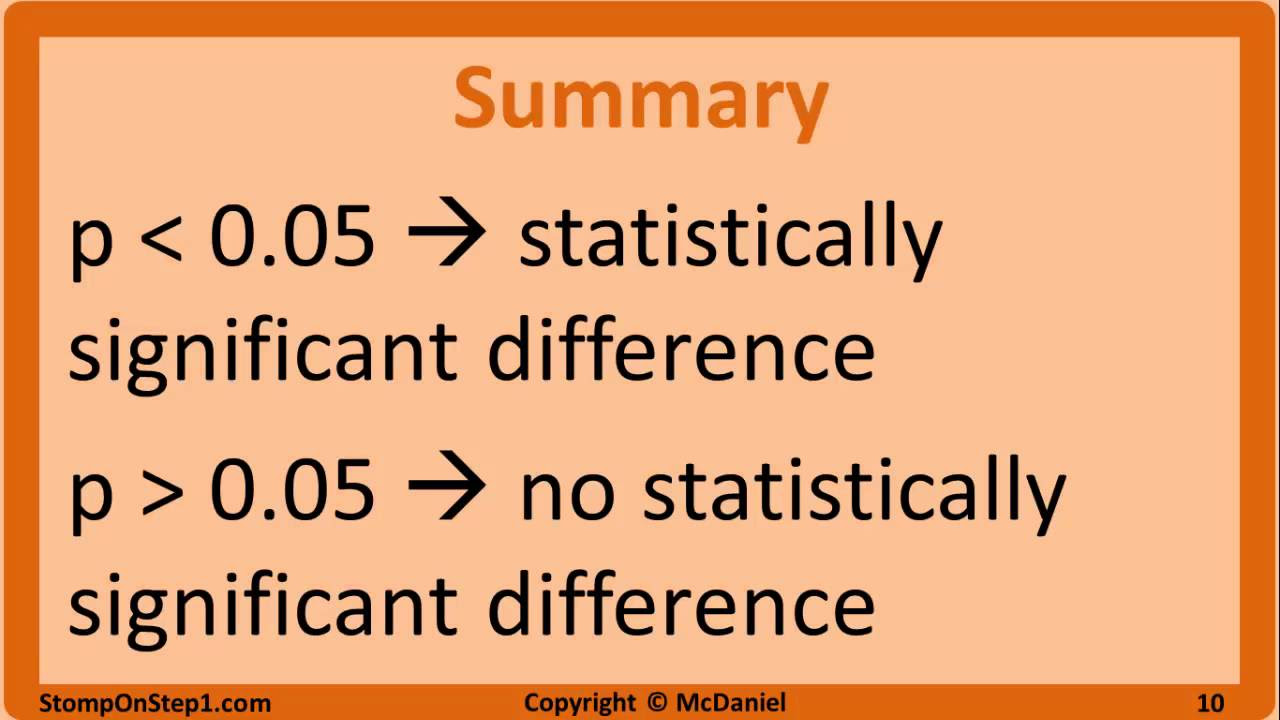
- 🔑 The level of significance (alpha) is highlighted as a crucial parameter in hypothesis testing, determining the threshold for rejecting the null hypothesis.
- 🧩 The script covers significant treatment difference, power, and sample size, emphasizing the balance between detecting an effect and avoiding type I and type II errors.
- 🔬 An example involving surgical treatment for proximal humerus fractures is used to demonstrate how to apply hypothesis testing in a practical scenario.
- 📘 The video concludes with a deeper dive into power and sample size calculations, illustrating how these elements influence the ability to detect an effect when it exists.
- 🔑 The importance of understanding statistical concepts such as hypothesis testing, p-values, and confidence intervals is reinforced for making informed inferences from data.
Q & A
What is the main topic of the video?
-The main topic of the video is statistical inference, specifically focusing on hypothesis testing.
Who is the presenter of the video?
-The presenter of the video is Justin Zeltser.
What is the purpose of hypothesis testing in statistics?
-The purpose of hypothesis testing is to make inferences about a population parameter based on a sample. It helps to determine whether the observed sample results are likely to have occurred under the null hypothesis or if there is enough evidence to suggest an alternative hypothesis.
What is the null hypothesis in the context of the video?
-In the context of the video, the null hypothesis is defined as the starting assumption that there is no effect or no difference between the groups being studied, symbolized by the population parameter theta being equal to zero.
What is the concept of level of significance in hypothesis testing?
-The level of significance, often denoted by alpha (α), is the probability of rejecting the null hypothesis when it is actually true. It represents the threshold for deciding when the sample evidence is strong enough to reject the null hypothesis.
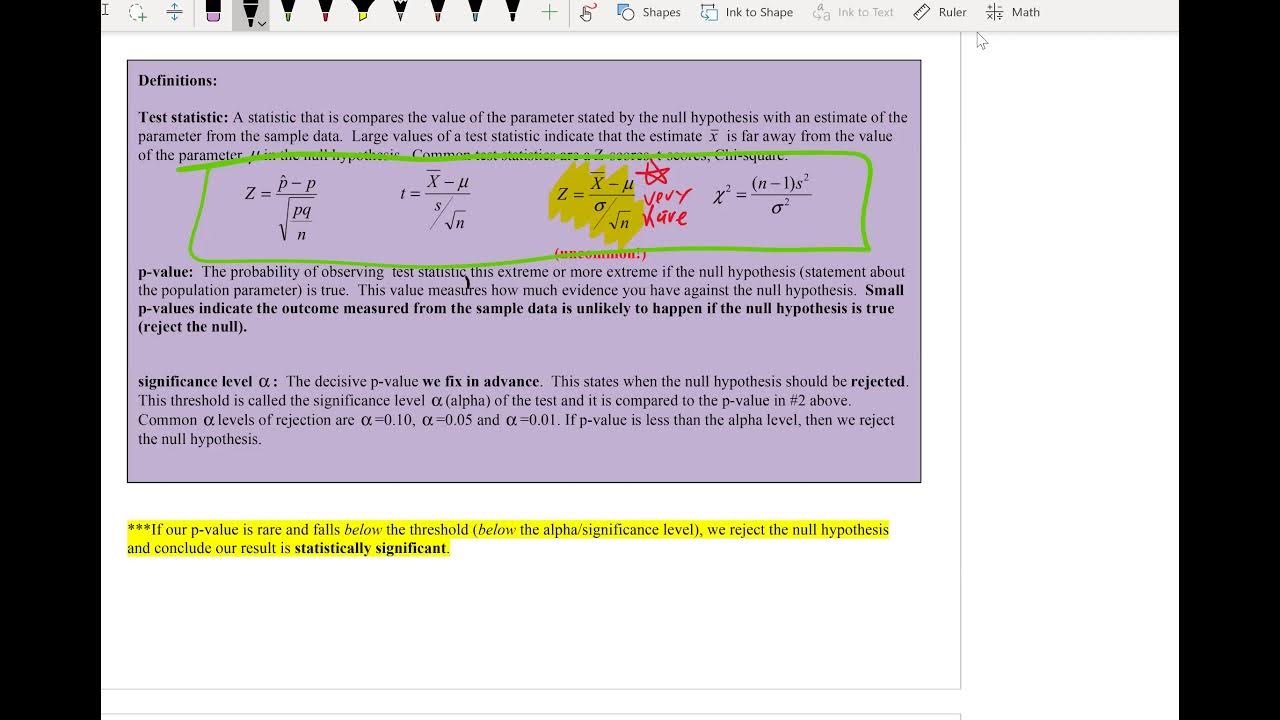
What is a test statistic and how is it used in hypothesis testing?
-A test statistic is a numerical value calculated from the sample data, which is used to make a decision in a hypothesis test. It is used to determine the likelihood of the observed data under the null hypothesis and is compared to a critical value to decide whether to reject the null hypothesis.
What is the difference between a one-tailed and a two-tailed test?
-A one-tailed test focuses on rejecting the null hypothesis in one direction (either greater than or less than the null hypothesis value), while a two-tailed test considers rejecting the null hypothesis in both directions. The choice between one-tailed and two-tailed tests depends on the research question being asked.
What is a p-value and why is it important in hypothesis testing?
-The p-value is the probability of obtaining a test statistic at least as extreme as the one observed, assuming the null hypothesis is true. It is important because if the p-value is less than the chosen level of significance, it provides enough evidence to reject the null hypothesis.
What is the relationship between confidence intervals and hypothesis testing?
-Confidence intervals provide an estimate of a population parameter with a certain level of confidence, while hypothesis testing makes a decision to reject or not reject a null hypothesis. Both methods are related in that they rely on sample data and the concept of probability, but they serve different purposes in statistical analysis.
What is the concept of power in hypothesis testing?
-The power of a statistical test is the probability that it will reject a false null hypothesis (i.e., detect an effect when there is one). It is influenced by the size of the effect, the sample size, and the level of significance.
How does sample size affect the outcome of a hypothesis test?
-Sample size affects the outcome of a hypothesis test by influencing the precision of the estimates and the power of the test. Larger sample sizes can provide more precise estimates and increase the power to detect an effect if one exists.
What is the Central Limit Theorem (CLT) and why is it important in hypothesis testing?
-The Central Limit Theorem (CLT) states that the distribution of sample means tends to be normal (Gaussian) as the sample size gets larger, regardless of the shape of the population distribution. This is important in hypothesis testing because it allows for the use of normal theory-based tests and confidence intervals even when the population distribution is unknown.
Outlines
📚 Introduction to Hypothesis Testing
The video begins with an introduction to the concept of hypothesis testing in statistical inference by Justin Zeltser. The presenter outlines the structure of the video, which includes an intuitive look at hypothesis testing without delving into numbers initially. The aim is to provide a comprehensive understanding of the topic, starting with the basics and moving through various subtopics like the null hypothesis, alternate hypothesis, level of significance, test statistic, and p-value. The presenter also promises to cover confidence intervals, significance, power, and sample size, suggesting that these concepts are interconnected and crucial for a full grasp of hypothesis testing.
🎯 Hypothesis Testing: Intuition and Coin Bias Example
This paragraph delves into the intuition behind hypothesis testing using a coin bias example. The presenter explains the concept of a fair coin and how hypothesis testing can help determine if a coin is biased towards showing more tails than heads. The idea of a sample, critical value, and rejection region are introduced to illustrate the process of hypothesis testing. The paragraph emphasizes the importance of assessing how extreme a sample is in relation to the null hypothesis and deciding whether the evidence is sufficient to reject the assumption of fairness.
🔍 Exploring the Null and Alternate Hypotheses
The presenter discusses the null hypothesis and the alternate hypothesis in the context of hypothesis testing. Using the example of surgical treatments for proximal humerus fractures, the video explains how to set up these hypotheses to test for a difference in outcomes between operative treatment and physiotherapy. The concept of level of significance (alpha) is introduced, highlighting its role in determining the likelihood of rejecting a true null hypothesis, which is a type 1 error.
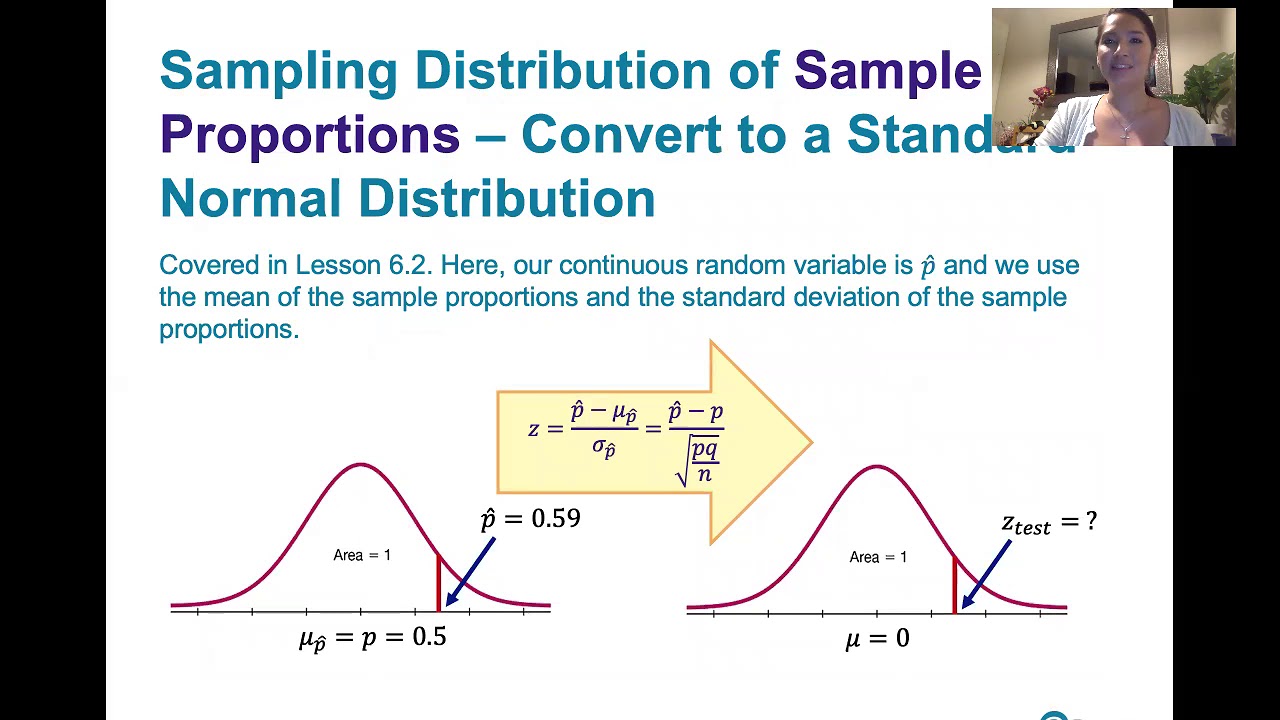
📉 Understanding Test Statistics and Distributions
The paragraph explains the concept of a test statistic in hypothesis testing, which is used to determine how extreme a sample is relative to the null hypothesis. The presenter uses the central limit theorem to justify the normal distribution of the test statistic, even when dealing with proportions from binomial distributions. The standard error of the test statistic is calculated, and the concept of critical values is introduced, which help in determining the rejection region for the hypothesis test.
📊 Hypothesis Testing in Action: Surgical Treatment Outcomes
The presenter applies the concepts of hypothesis testing to an example involving surgical and non-surgical treatments for ankle fractures in children. The video demonstrates how to calculate the test statistic and determine its position relative to the critical value, which helps in deciding whether to reject the null hypothesis. The significance of the chosen level of significance and its impact on the decision to reject or fail to reject the null hypothesis is emphasized.
📝 The Role of P-Values in Statistical Decisions
This paragraph explores the concept of p-values in hypothesis testing. The p-value is defined as the probability of obtaining a test statistic as extreme or more extreme than the one calculated from the sample, assuming the null hypothesis is true. The relationship between p-values, the level of significance (alpha), and the decision to reject the null hypothesis is discussed. The paragraph also clarifies the difference between proving and inferring in statistical analysis.
🛡️ Confidence Intervals: Estimating Population Parameters
The presenter introduces confidence intervals as a method to estimate population parameters based on sample statistics. The paragraph explains how to calculate the standard error of a sample statistic and use it to construct a confidence interval. The video illustrates how confidence intervals provide a range within which the true population parameter is likely to fall, with a certain level of confidence.
🔄 Comparing Hypothesis Testing and Confidence Intervals
This paragraph compares hypothesis testing and confidence intervals as tools for statistical inference. The presenter discusses how confidence intervals can provide a more nuanced understanding of the population parameter by considering the sample's perspective, unlike hypothesis testing, which focuses on the null hypothesis. The video also touches on the concept of significant treatment difference and how confidence intervals can be used to assess whether a certain improvement threshold has been met.
🔧 Power and Sample Size in Statistical Testing
The video discusses the concepts of power and sample size in the context of hypothesis testing. Power is defined as the probability of correctly rejecting a false null hypothesis, while sample size affects the precision of the estimates and the power of the test. The presenter explains how increasing the sample size or the effect size can increase the power of the test to detect a true effect. The paragraph also introduces the idea of type 1 and type 2 errors in relation to power and sample size.
📘 Calculating Power and Sample Size for Ankle Fracture Treatment
The presenter provides an example to calculate the power of a hypothesis test to detect a 10% improvement in the operative cohort for ankle fractures in children. The video demonstrates the process of calculating the variances for the null and alternative hypotheses and using these to determine the power of the test. The example illustrates how the power of a test can be influenced by the specified difference and the sample size.
🔄 Determining Sample Size for a Given Power
The final paragraph focuses on calculating the required sample size to achieve a specific power in a hypothesis test. The presenter outlines the steps to determine the sample size needed to provide a power of 90% for detecting a 10% improvement in the operative cohort. The video concludes with the algebraic process of solving for the sample size, emphasizing the importance of rounding up to ensure adequate power in the test.
Mindmap
Keywords
💡Hypothesis Testing
💡Null Hypothesis
💡Alternate Hypothesis
💡Level of Significance
💡Test Statistic
💡P-Value
💡Confidence Interval
💡Power
💡Sample Size
💡Type I and Type II Errors
Highlights
Introduction to the third video on statistical inference, focusing on hypothesis testing.
Explaining the intuition behind hypothesis testing without involving numbers.
Using a coin flip example to illustrate the concept of hypothesis testing.
Defining the null hypothesis and the concept of level of significance in hypothesis testing.
Discussion on test statistics and the accompanying p-value generation.
Differentiating between one-tailed and two-tailed tests in hypothesis testing.
Introducing the concept of confidence intervals and their relationship with p-values.
Exploring the significance of treatment difference, power, and sample size in hypothesis testing.
Providing an example of surgical treatment outcomes to demonstrate hypothesis testing.
Calculating and interpreting the test statistic and p-value from the surgical treatment example.
Visualizing the concept of rejection region in hypothesis testing.
Describing the Central Limit Theorem and its importance in hypothesis testing.
Analyzing the relationship between p-value, level of significance, and hypothesis rejection.
Constructing and interpreting a confidence interval for a sample statistic.
Applying hypothesis testing to determine if a treatment difference is statistically significant.
Discussing the concept of power in hypothesis testing and its calculation.
Providing an example to calculate the power of a hypothesis test for a medical treatment.
Exploring the impact of sample size on the power of a statistical test.
Concluding with a summary of key concepts in hypothesis testing and their practical applications.
Transcripts
Browse More Related Video

AP Statistics Unit 6 Summary Review Inference for Proportions Part 2 Significance Tests

HYPOTHESIS TESTING BASICS: Type 1/Type 2 errors | Statistical power
8.1.3 Basics of Hypothesis Testing - Computing and Interpreting Test Statistics
Math 119 Chap 8 part 1
Null Hypothesis, p-Value, Statistical Significance, Type 1 Error and Type 2 Error
Hypothesis testing: step-by-step, p-value, t-test for difference of two means - Statistics Help
5.0 / 5 (0 votes)
Thanks for rating: