Hypothesis testing: step-by-step, p-value, t-test for difference of two means - Statistics Help
TLDRThis video script offers a comprehensive guide to hypothesis testing, a fundamental procedure in inferential statistics. It outlines the five key steps: formulating null (H0) and alternative (H1) hypotheses, determining the significance level (alpha), sampling from the population, calculating the p-value, and making a decision based on the p-value. The script uses an engaging example involving Helen's choconutties sales to illustrate the process. It explains the concepts of two-tailed and one-tailed tests, and emphasizes the importance of using sample data to infer population parameters. The example concludes with a decision to reject the null hypothesis based on a p-value less than the chosen significance level, indicating a significant difference in sales when a free sticker is offered. The script encourages viewers to further explore understanding the p-value and conducting two-means tests in Excel.
Takeaways
- 🔍 **Hypothesis Testing Overview**: Hypothesis testing is a statistical method to make inferences about a population from a sample.
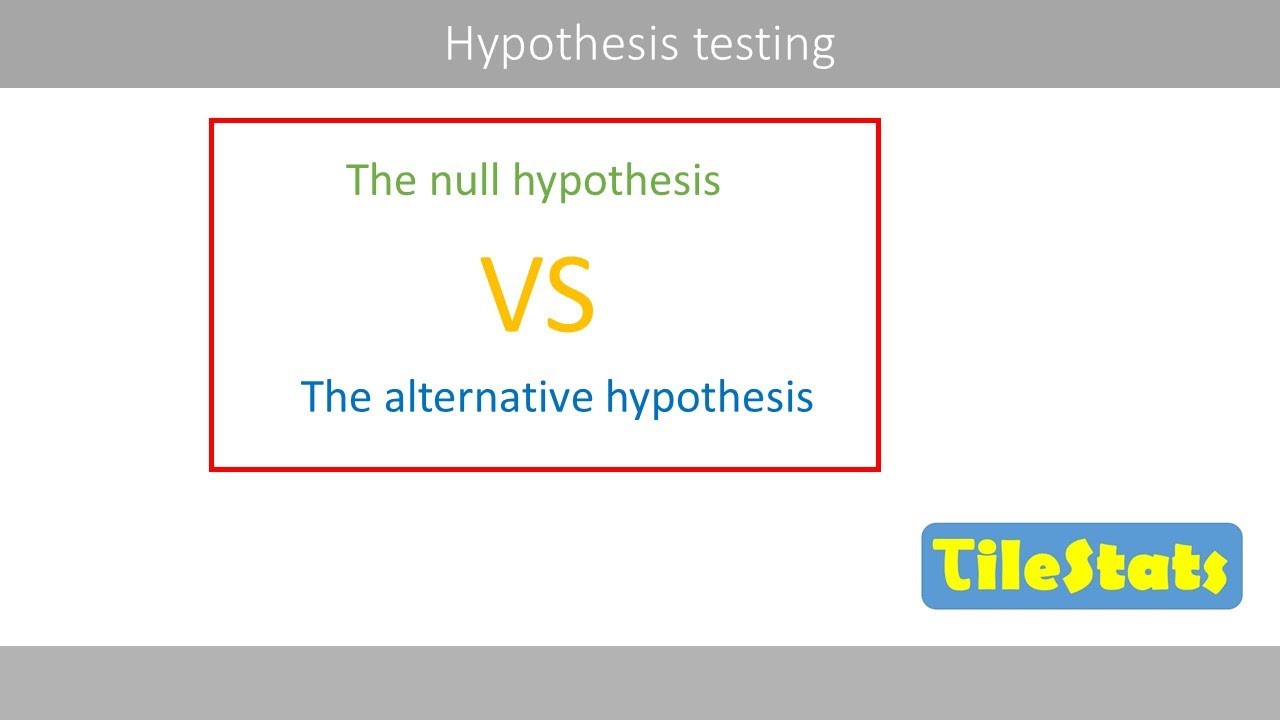
- ⚖️ **Setting Up Hypotheses**: Establish a null hypothesis (H0) and an alternative hypothesis (H1 or Ha), where H0 represents the status quo and H1 what you're trying to prove.
- 📊 **Significance Level**: Choose a significance level, commonly 0.05 or alpha, which is the probability of a type 1 error—incorrectly rejecting a true null hypothesis.
- 🎯 **Sample Selection**: Take a sample from the population to gather data for statistical analysis.
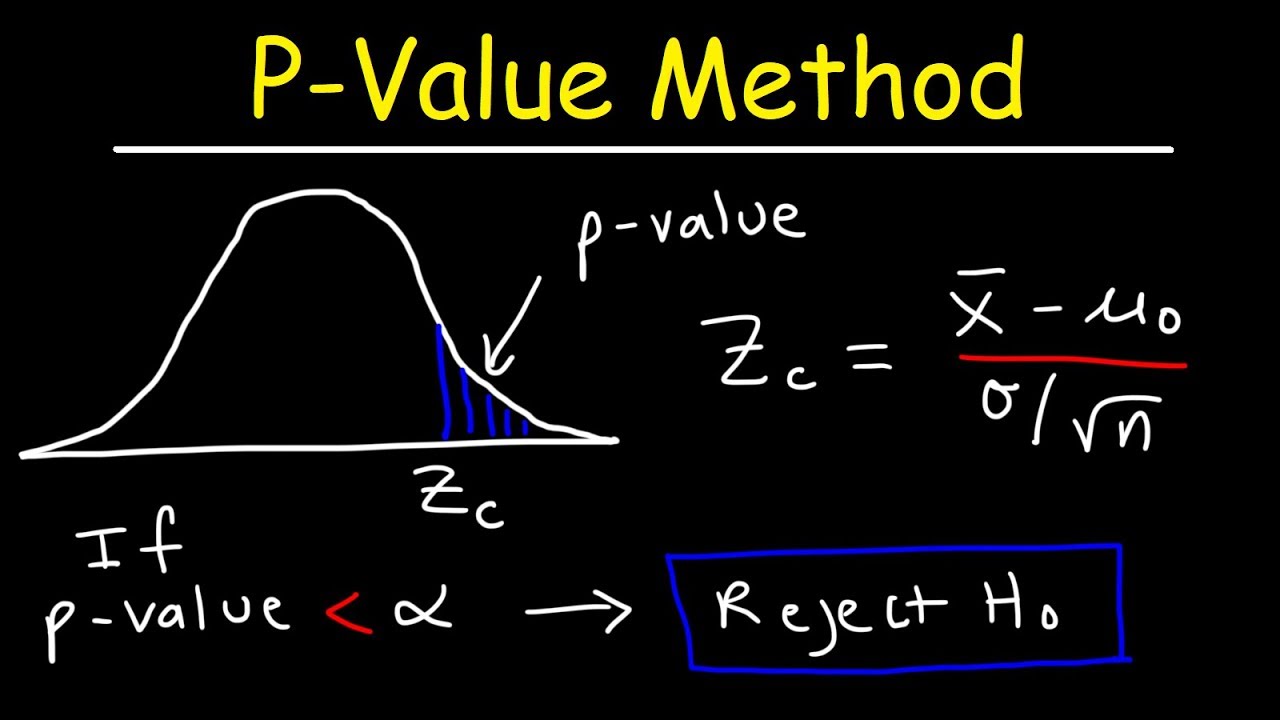
- 🧮 **P-Value Calculation**: Calculate the p-value using statistical software, which will be used to determine the validity of the null hypothesis.
- ✅ **Decision Making**: If the p-value is less than the chosen significance level, reject the null hypothesis; otherwise, do not reject it.
- 📚 **Example Scenario**: Helen's choconutties sales experiment is used to illustrate hypothesis testing steps, including setting up hypotheses, significance level, and analyzing sales data.
- 🧲 **Randomization in Sampling**: To ensure a fair test, Helen randomizes the offering of free stickers by flipping a coin each day.
- 📈 **Mean Sales as a Statistic**: The mean or average value of daily sales serves as the statistic of interest in Helen's experiment.
- 📉 **Null vs. Alternative Hypothesis**: The null hypothesis states no difference in sales between treatments, while the alternative suggests a difference.
- 📝 **Two-Tailed vs. One-Tailed Test**: A two-tailed test considers differences in both directions, whereas a one-tailed test focuses on a specific direction (e.g., sales increase).
- 📊 **Data Analysis Tools**: Use tools like Excel for data visualization and p-value calculation, as demonstrated in the 'Two means t-test in Excel' video.
Q & A
What is the fundamental concept behind hypothesis testing in inferential statistics?
-Hypothesis testing is based on the idea that we can make inferences about a population from a sample taken from it. It allows us to test whether there is evidence to support or refute a claim about the population parameters.
What are the two types of hypotheses typically established in hypothesis testing?
-The two types of hypotheses are the null hypothesis (H0), which represents the status quo or no effect, and the alternative hypothesis (H1 or Ha), which is what we are trying to provide evidence for and is the opposite of the null hypothesis.
What is the significance level in hypothesis testing, and why is it important?
-The significance level, often denoted as alpha (α), is the probability of rejecting the null hypothesis when it is actually true, also known as a type I error. It is important because it sets the threshold for deciding whether the evidence is strong enough to reject the null hypothesis.
What is a p-value in the context of hypothesis testing, and how is it used?
-The p-value is the probability of observing a test statistic as extreme as, or more extreme than, the one calculated from the sample data, under the assumption that the null hypothesis is true. It is used to decide whether to reject the null hypothesis; if the p-value is less than the chosen significance level, the null hypothesis is rejected.
How does the example of Helen and her Choco-nutties illustrate the application of hypothesis testing?
-Helen's example demonstrates hypothesis testing through a real-world scenario. She sets up null and alternative hypotheses regarding the effect of offering a free sticker on sales. She then collects data, calculates the p-value, and uses it to decide whether to reject the null hypothesis, thus determining if offering a free sticker impacts sales.
What is the difference between a one-tailed and a two-tailed test in hypothesis testing?
-A one-tailed test is used when the alternative hypothesis predicts a change in a specific direction (e.g., sales will increase). A two-tailed test, on the other hand, is used when the alternative hypothesis predicts a change in either direction (e.g., sales will increase or decrease). The choice between one-tailed and two-tailed tests depends on the nature of the research question.
Why is it important to use a random process, such as flipping a coin, in Helen's experiment?
-Using a random process ensures that the assignment of the treatment (offering a free sticker or not) is not biased. This randomness helps to eliminate other factors that might affect the results and allows for a more accurate assessment of the impact of the treatment on sales.
What does it mean to reject the null hypothesis in the context of Helen's sales data?
-Rejecting the null hypothesis in Helen's case means that the data provides evidence to suggest that there is a statistically significant difference in mean sales between days when a free sticker is offered and days when it is not, based on the chosen significance level.
How does the sample mean differ from the population mean in hypothesis testing?
-The sample mean is the average value calculated from the data collected in the sample, while the population mean is the average value for the entire population. Hypothesis testing uses the sample mean to make inferences about the population mean, under the assumption that the sample is representative of the population.
What is the role of Excel or other statistical software in calculating the p-value in hypothesis testing?
-Excel or other statistical software is used to perform the necessary calculations, including the computation of the p-value. These tools can handle complex statistical formulas and large datasets efficiently, providing a more accurate and less time-consuming way to analyze the results of a hypothesis test.
What is the implication of the p-value being less than 0.05 in Helen's experiment?
-If the p-value is less than 0.05, it indicates that there is less than a 5% probability that the observed difference in sales is due to chance alone. This leads to the rejection of the null hypothesis, suggesting that offering a free sticker has a statistically significant effect on the mean sales.
Outlines
🔍 Hypothesis Testing Explained
This paragraph introduces the concept of hypothesis testing in inferential statistics, emphasizing its five critical steps: establishing hypotheses (null and alternative), determining significance level, sampling, calculating the p-value, and making a decision based on the p-value. It highlights that the goal is to disprove the null hypothesis, not to prove the alternative. The paragraph also clarifies that hypotheses are about population parameters, not sample statistics, and that the null hypothesis typically represents no effect or the status quo.
📈 Hypothesis Testing with Sales Data
This paragraph presents a practical example of hypothesis testing applied to a sales scenario. Helen, who sells Choco-nutties, is interested in whether offering a free gift increases sales. The paragraph outlines the steps taken to test this hypothesis, including setting up the null and alternative hypotheses, choosing a significance level, collecting sales data, calculating the p-value, and interpreting the results. The example illustrates how a two-tailed test can be used to explore the possibility of increased or decreased sales due to the free gift, and it provides a walkthrough of the statistical analysis process using Excel.
Mindmap
Keywords
💡Hypothesis testing
💡Null hypothesis (H0)
💡Alternative hypothesis (H1 or Ha)
💡Significance level (alpha)
💡Sample
💡P-value
💡Type I error
💡Population parameters
💡Two-tailed test
💡One-tailed test
💡Excel analysis
Highlights
Hypothesis testing is a key procedure in inferential statistics
Based on the idea that we can tell things about the population from a sample
Hypothesis testing can be explained in five steps: hypotheses, significance, sample, p-value, decide
Decide on your hypotheses: null hypothesis (H0) and alternative hypothesis (H1 or Ha)
Inferential statistics is based on the premise that you cannot prove something to be true, but you can disprove it by finding an exception
The alternative hypothesis is what we're trying to provide evidence for, while the null hypothesis is the opposite or status quo
Hypotheses are always about population parameters, not sample values or statistics
The null hypothesis usually refers to the status quo, representing no effect
The null hypothesis should include a statement of equality, while the alternative should not
Decide on the level of significance (alpha value), typically 0.05
Significance level is the probability of saying the null hypothesis is wrong when it is actually correct (Type 1 error)
Take a sample from the population to provide the statistics needed
Calculate the p-value, usually done by a computer package
Use the p-value to decide whether to reject the null hypothesis. If p-value is less than the significance level, reject the null hypothesis
Example: Helen sells Choco-nutties and wants to test if offering a free gift increases sales
The population is all days of selling Choco-nutties, and the sample is the days in the next month
Null hypothesis: no difference in sales between offering a free sticker and not offering one
Alternative hypothesis: mean sales differ depending on whether a free sticker is offered
Use sample means to make inferences about population means and the difference between them
Two-tailed test is exploratory, interested in differences from zero in both directions
One-tailed test is directional, interested in if sales increase due to the free sticker
Choose a significance level (alpha = 0.05)
Helen collects 23 days of sales data, 13 with free stickers and 10 without
Mean sales are $301.92 with free stickers and $265.83 without
P-value for two-tailed test is 0.02, indicating evidence to reject the null hypothesis
Data suggests a difference in mean sales depending on whether a free sticker is offered
Transcripts
Browse More Related Video
The basic steps of hypothesis testing

P-value in statistics: Understanding the p-value and what it tells us - Statistics Help
P-Value Method For Hypothesis Testing

Using a z-score to complete hypothesis testing for a claim of equality

Elementary Stats Lesson #18

AP Statistics Unit 6 Summary Review Inference for Proportions Part 2 Significance Tests
5.0 / 5 (0 votes)
Thanks for rating: