Elementary Statistics Chapter 8 - Introduction Hypothesis Testing Part 1 Lesson 1
TLDRThis script introduces the concept of hypothesis testing, which uses sample statistics to evaluate claims about population parameters. It explains the formulation of null (H0) and alternative (Ha) hypotheses, their complementarity, and how to translate verbal claims into mathematical statements. The script also covers types of errors in hypothesis testing, significance levels, and the process of determining test statistics for different types of tests, including left-tailed, right-tailed, and two-tailed tests.
Takeaways
- 📝 Hypothesis testing uses sample statistics to evaluate claims about population parameters.
- 🔍 A statistical hypothesis is a claim about a population parameter, with two types: the null hypothesis (H0) and the alternative hypothesis (H1).
- ⚖️ The null hypothesis typically states an equality, such as less than or equal to, equal to, or greater than or equal to.
- 🔄 The alternative hypothesis is the complement of the null hypothesis, indicating inequality like greater than, not equal to, or less than.
- 📈 When translating verbal claims into mathematical statements for hypotheses, the claim is always next to the hypothesis statement representing it.
- 🚗 Example: If a car dealership claims the mean oil change time is less than 15 minutes, the null hypothesis would be greater than or equal to 15 minutes, and the alternative would be less than 15 minutes.
- 🎓 Hypothesis testing begins by assuming the null hypothesis is true and ends with a decision to either reject or fail to reject the null hypothesis based on sample evidence.
- 🔮 Type I error occurs when the null hypothesis is incorrectly rejected when it is true, while Type II error occurs when the null hypothesis is not rejected when it is false.
- 🛑 The level of significance (alpha) sets the threshold for deciding to reject the null hypothesis, with common levels being 0.1, 0.05, or 0.01.
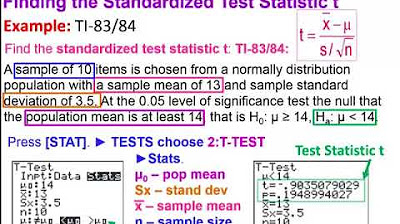
- 📊 The test statistic, derived from sample data, is used to determine if the null hypothesis should be rejected, with different types of tests (z-score, t-distribution) depending on the sample size and the parameter being tested.
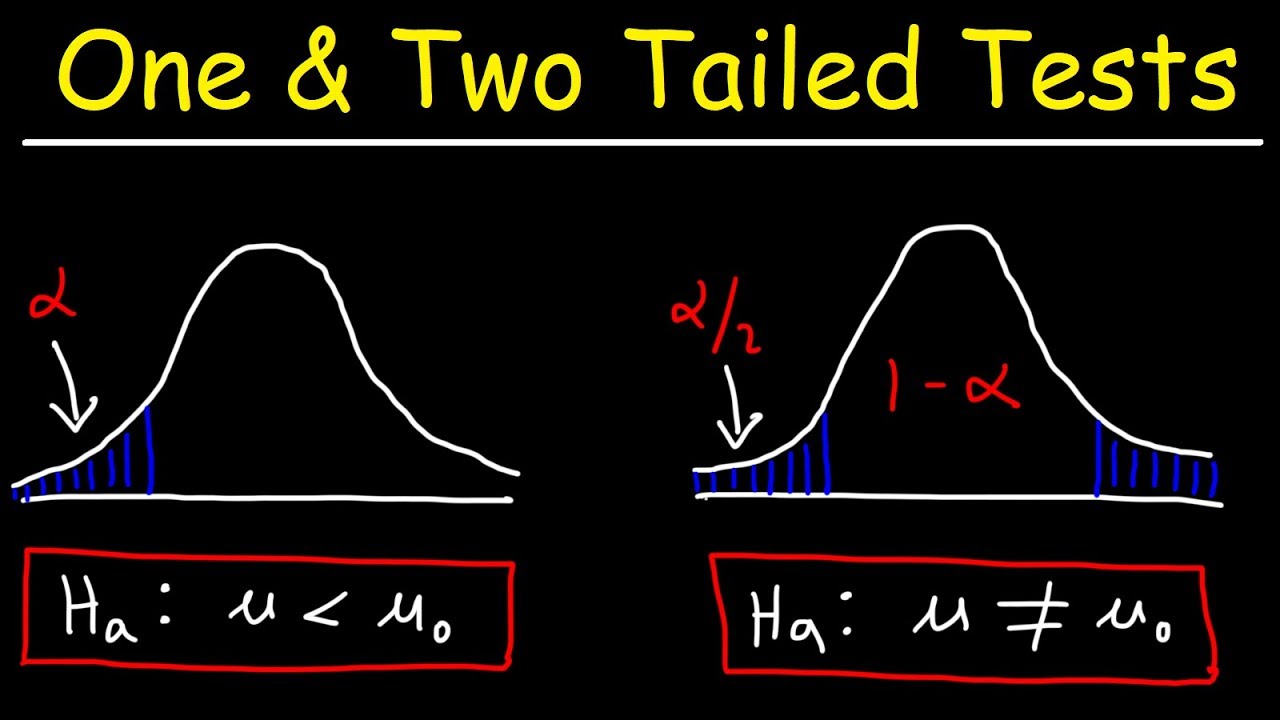
- 📉 The nature of the test determines if it's a left-tailed, right-tailed, or two-tailed test, which influences the rejection region based on the alternative hypothesis.
Q & A
What is a hypothesis test?
-A hypothesis test is a statistical process that uses sample statistics to evaluate a claim about the value of a population parameter. It involves stating a pair of hypotheses, one representing the claim and the other its complement, and determining which is true based on the sample data.
What are the two types of hypotheses in a hypothesis test?
-The two types of hypotheses are the null hypothesis (H0 or H₀), which contains a statement of equality, and the alternative hypothesis (Ha or H₁), which is a statement of inequality and is the complement to the null hypothesis.
How do you state the null hypothesis?
-The null hypothesis is a statistical hypothesis that includes a statement of equality such as less than or equal to, equal to, or greater than or equal to. It is denoted with H0 or H₀.
What is the role of the alternative hypothesis?
-The alternative hypothesis is the complement to the null hypothesis. It must be true if the null hypothesis is false, and it is denoted with Ha or H₁.
How do you translate a verbal claim into a mathematical statement for a hypothesis test?
-You translate the claim by stating the null and alternative hypotheses mathematically, ensuring that the claim is represented in one of the hypotheses and its complement in the other.
What is an example of a null hypothesis in the context of a car dealership's claim about oil change time?
-If a car dealership claims that the mean time for an oil change is less than 15 minutes, the null hypothesis would be that the mean time is less than 15 minutes.
How do you identify the type of error made when the null hypothesis is rejected when it is actually true?
-This is known as a Type I error, which occurs when the null hypothesis is incorrectly rejected even though it is true.
What is the significance of the level of significance (alpha) in hypothesis testing?
-The level of significance, denoted by alpha, is the maximum allowed probability of making a Type I error. It determines the threshold for rejecting the null hypothesis based on the sample data.
What are the different types of hypothesis tests based on the alternative hypothesis?
-The types of hypothesis tests are left-tailed, right-tailed, and two-tailed tests, which are determined by whether the alternative hypothesis suggests the parameter is less than, greater than, or not equal to the value stated in the null hypothesis.
How do you determine whether a hypothesis test is left-tailed, right-tailed, or two-tailed?
-You determine the type of test by looking at the alternative hypothesis. If it suggests the parameter is less than a certain value, it's a left-tailed test. If it suggests the parameter is greater than a certain value, it's a right-tailed test. If the alternative hypothesis is not equal to a certain value, it's a two-tailed test.
What is the purpose of a test statistic in hypothesis testing?
-A test statistic is a numerical value calculated from the sample data that is used to determine whether to reject the null hypothesis. It converts the sample statistic into a standardized score, assuming the null hypothesis is true.
Outlines
🔍 Introduction to Hypothesis Testing
This paragraph introduces the concept of hypothesis testing, a statistical method that uses sample data to evaluate claims about population parameters. It explains the necessity of stating a pair of hypotheses: the null hypothesis (H₀), which posits a condition of equality, and the alternative hypothesis (H₁), which represents the inequality. The paragraph emphasizes the complementary nature of these hypotheses and provides examples of how to translate verbal claims into mathematical statements for hypothesis testing. It also illustrates how to identify the claim within the hypotheses and the importance of doing so accurately.
📚 Writing Hypothesis Statements
The second paragraph delves into the process of writing hypothesis statements from verbal claims. It provides examples of how to formulate null and alternative hypotheses for various scenarios, such as a car dealership's claim about oil change times, a school's claim about student involvement in extracurricular activities, and a company's claim about the life of its furnaces. The paragraph clarifies that the null hypothesis always contains an equality statement, while the alternative is its complement. It also discusses the significance of correctly identifying the claim within the hypothesis statements.
🚦 Hypothesis Testing Errors and Significance Levels
This paragraph discusses the potential errors in hypothesis testing, specifically Type I and Type II errors, which occur when the null hypothesis is incorrectly rejected or not rejected, respectively. It introduces the concept of the significance level, denoted by alpha (α), which is the maximum allowed probability of committing a Type I error. Common alpha levels are 0.1, 0.05, and 0.01. The paragraph also outlines the steps involved in a statistical test, including stating the hypotheses, identifying the alpha level, finding the test statistic, and determining the decision based on the sample data.
📉 Understanding Test Statistics and Rejection Regions
The final paragraph explains the calculation of test statistics from sample data and how they are used to make decisions about the null hypothesis. It discusses the nature of test statistics, such as z-scores and t-distributions, and how they are used depending on the sample size and the type of data (mean, proportion). The paragraph also explains the concept of rejection regions, which are determined by the alternative hypothesis and can be left-tailed, right-tailed, or two-tailed tests. It emphasizes the importance of identifying the correct type of test based on the alternative hypothesis and provides examples to illustrate the process.
Mindmap
Keywords
💡Hypothesis Testing
💡Null Hypothesis (H0)
💡Alternative Hypothesis (Ha or H1)
💡Type I Error
💡Type II Error
💡Significance Level (Alpha)
💡Test Statistic
💡Left-Tailed Test
💡Right-Tailed Test
💡Two-Tailed Test
Highlights
Hypothesis testing uses sample statistics to verify claims about population parameters.
A statistical hypothesis is a claim about a population parameter, with a pair of hypotheses representing the claim and its complement.
The null hypothesis (H0) contains a statement of equality, while the alternative hypothesis (Ha) represents inequality.
When stating hypotheses, translate verbal claims into mathematical statements, ensuring the null hypothesis contains the 'claim' word.
Examples provided include translating claims about mean time for an oil change, student involvement in extracurricular activities, and mean life of a furnace into hypothesis statements.
Hypothesis testing begins by assuming the null hypothesis is true and results in a decision to either reject or fail to reject it.
Type I error occurs when the null hypothesis is wrongly rejected, analogous to convicting an innocent person.
Type II error happens when the null hypothesis is not rejected when it is false, similar to acquitting a guilty person.
The significance level (alpha) is the maximum allowed probability of making a Type I error, commonly set at 0.1, 0.05, or 0.01.
The test statistic is calculated from a sample and used to make a decision about the null hypothesis under the assumption that it is true.
Different tests are used based on the sample size and the type of parameter being tested, such as z-scores for large samples and t-scores for smaller ones.
The nature of hypothesis testing includes identifying the type of test (left-tailed, right-tailed, or two-tailed) based on the alternative hypothesis statement.
The rejection region for a hypothesis test is determined by the alternative hypothesis and the significance level.
Practice is essential for correctly writing hypothesis statements and identifying the type of test based on the claim.
Understanding the implications of Type I and Type II errors is crucial for proper hypothesis testing and decision-making.
Transcripts
Browse More Related Video
One Tailed and Two Tailed Tests, Critical Values, & Significance Level - Inferential Statistics

Elementary Stats Lesson #18
Elementary Statistics - Chapter 8 - Hypothesis Testing Part 3 Revised
Hypothesis testing: step-by-step, p-value, t-test for difference of two means - Statistics Help

One-tailed and two-tailed tests | Inferential statistics | Probability and Statistics | Khan Academy
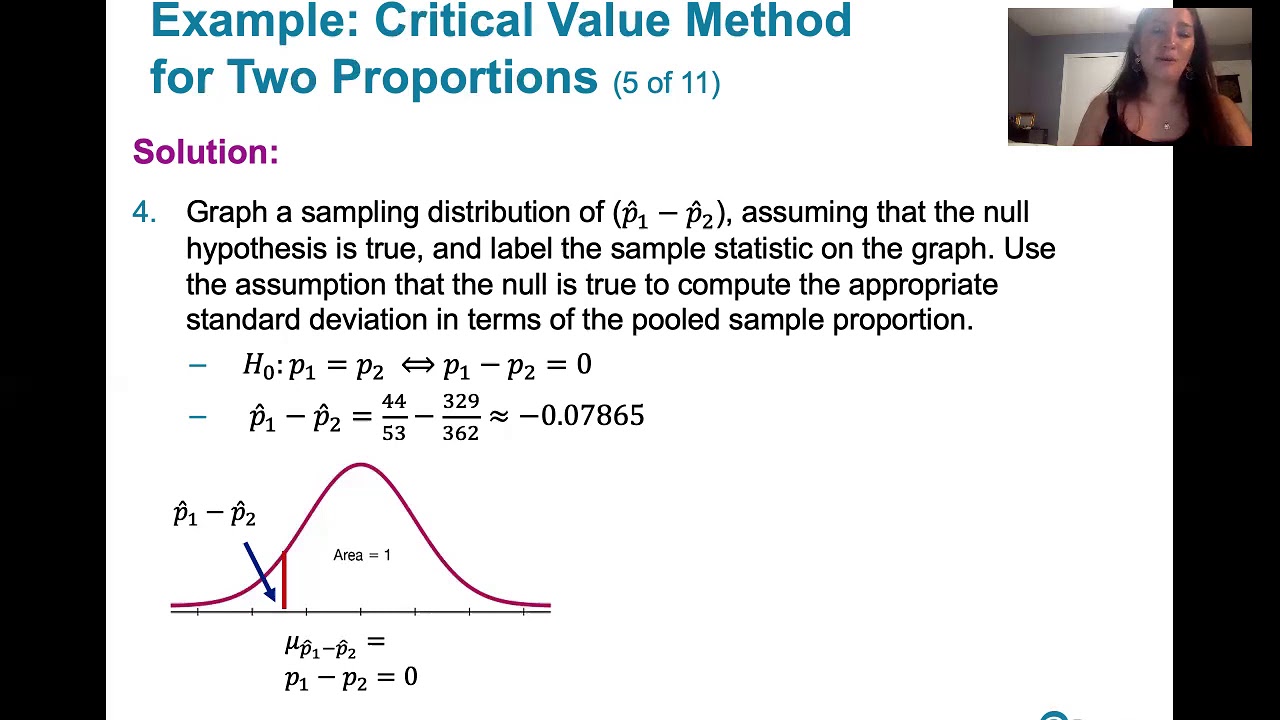
9.1.3 Two Proportions - Example, Critical Value Method, Normal Approximation
5.0 / 5 (0 votes)
Thanks for rating: