Ch. 1.11 Solving Equations and Inequalities Graphically
TLDRThis lecture introduces the concept of solving equations and inequalities graphically. The instructor emphasizes the utility of technology like Wolfram Alpha, Desmos, and calculators for graphing. Algebraic solutions are contrasted with graphical ones, highlighting the equivalence between the two methods. The process involves plotting both sides of an equation or inequality, identifying points of intersection for solutions, and understanding the domain restrictions for functions like square roots. The lecture also covers how to interpret the overlapping areas in inequalities, providing a practical guide to graphical problem-solving.
Takeaways
- 📈 The lecture is about solving equations and inequalities graphically using graphs.
- 🛠️ Students are encouraged to use any available technology such as Wolfram Alpha, calculators, or Desmos to explore graphical solutions.
- 🔄 Both algebraic and graphical methods can be used interchangeably to solve equations, as they both provide the same information.
- 📊 To solve equations graphically, one must graph both sides of the equation and find the points of intersection.
- 📚 An example is given where '2x + 3 = 8' is solved by graphing both sides and finding the intersection point.
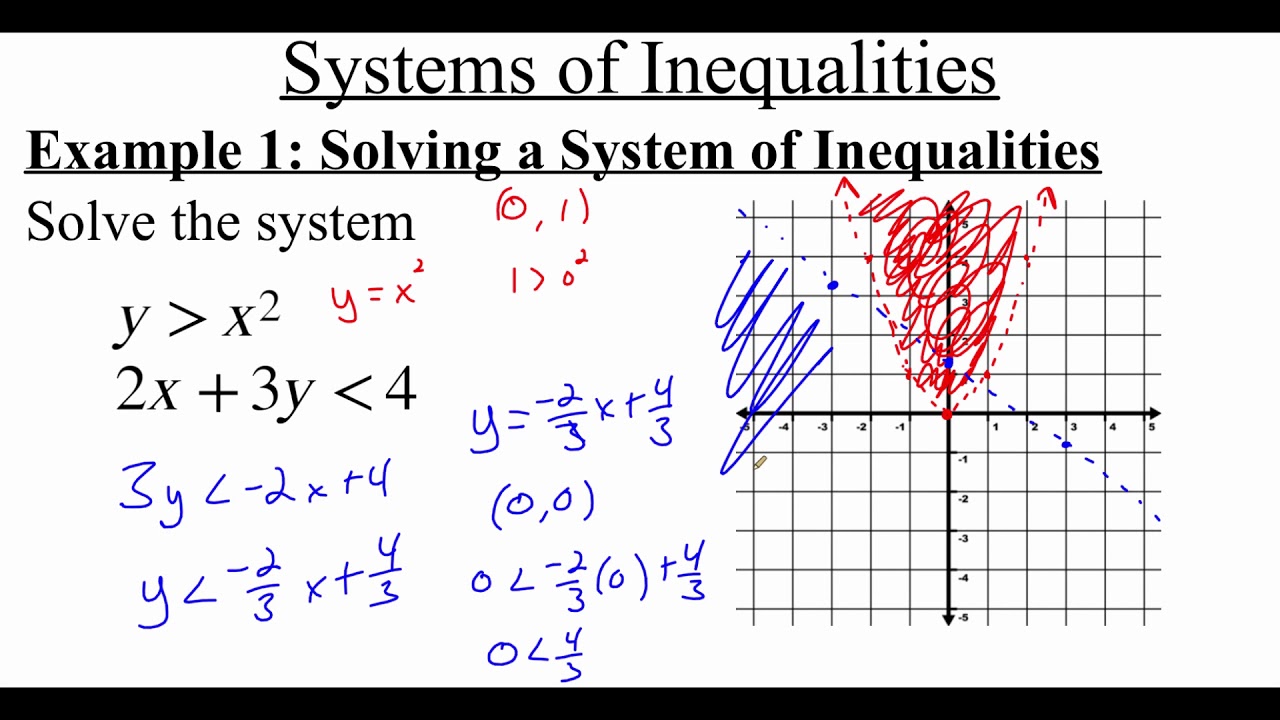
- 📉 For inequalities, the process is similar to equations, but the focus is on finding the overlapping areas of the graphs.
- 🔍 When graphing inequalities, it's important to consider the domain of the functions involved, as demonstrated with the square root function.
- 📍 The intersection points of the graphs indicate the solution to the equation or the interval for the inequality.
- 📐 The example of '3x - 5 = -x + 3' is solved both algebraically and graphically, showing that both methods yield the same solution of x = 2.
- 📈 The script explains how to graph linear equations by plotting points and finding the slope, using '3x - 5' and '-x + 3' as examples.
- 🚫 The importance of including or excluding certain points in the solution set based on whether the inequality is strict or non-strict is highlighted.
Q & A
What is the main topic of this lecture?
-The main topic of this lecture is solving equations and inequalities graphically.
What tools are suggested for use in this lecture?
-Tools such as Wolfram Alpha, calculators, and Desmos are suggested for graphing and solving equations and inequalities graphically.
Why is it beneficial to use technology when solving equations and inequalities graphically?
-Using technology can help visualize the graphs, making it easier to identify points of intersection and solve equations and inequalities.
What is the fundamental concept behind solving equations graphically?
-The fundamental concept is to graph both sides of the equation and find the points of intersection, which represent the solutions.
How do you graph the equation 2x + 3 = 8?
-You graph both 2x + 3 and y = 8, and find the point where these two lines intersect, which is the solution to the equation.
What is the solution to the equation 3x - 5 = -x + 3 when solved graphically?
-The solution is x = 2, found by graphing both 3x - 5 and -x + 3 and identifying the point of intersection.
How does solving an inequality graphically differ from solving it algebraically?
-Graphically, you don't have to worry about changing the direction of the inequality when multiplying or dividing by a negative number; you simply graph the inequalities and find the overlapping areas.
What is the domain limitation for the square root function in the script's example?
-The domain limitation is x ≥ 1, as the square root of a negative number is not defined in the real number system.
How do you determine the interval for which a quadratic function is less than a square root function?
-You graph both functions, find the points of intersection, and then identify the overlapping areas where the quadratic function is below the square root function, considering the domain limitations.
What does the script suggest about the solution set when you zero out an inequality?
-Zeroing out an inequality does not change the solution set, as long as the same operations are applied to both sides of the equation.
How do you interpret the graph when the inequality is strictly less than zero?
-You look for the areas below the function, as these represent the negative y-values, and identify the interval where the function is strictly less than zero.
What is the solution set for the inequality x^2 - 2x - 3 < √(x - 1) - 1 for x ≥ 1?
-The solution set is from x = 1 to x = 3.11, including 1 but not including 3.11, as the parabola is less than the square root function in this interval.
Outlines
📈 Solving Equations Graphically
This paragraph introduces the concept of solving equations and inequalities graphically. The lecturer emphasizes that any problem solvable algebraically can also be solved graphically and vice versa. The main idea is to graph both sides of an equation or inequality and find the points of intersection, which represent the solutions. An example is given using the equation 2x + 3 = 8, demonstrating how to plot both sides and find the intersection point. The importance of using technology like calculators or graphing software is highlighted as a helpful tool for visualization.
📊 Graphical Solutions for Quadratics and Inequalities
The second paragraph delves into solving quadratic inequalities graphically, contrasting it with algebraic methods. The lecturer explains that when graphing inequalities, one must consider the domain and the direction of the inequality. An example is provided where a quadratic function is compared with a square root function over a specific interval. The solution involves graphing both functions, finding the intersection point, and determining the interval where the quadratic is less than the square root function. The importance of including or excluding certain points based on the inequality's direction is discussed. The paragraph also touches on the concept of zeroing out an equation to find when a function is less than or equal to zero, illustrating how the solution set remains consistent despite the transformation.
Mindmap
Keywords
💡Graphical Solution
💡Equation
💡Inequality
💡Graph
💡Intersection
💡Algebraic Solution
💡Linear Equation
💡Quadratic Function
💡Square Root Function
💡Domain
💡Extraneous Solution
Highlights
Introduction to solving equations and inequalities graphically.
Use of technology like Wolfram Alpha, calculators, and Desmos for graphing.
Equivalence of algebraic and graphical methods for solving equations.
Graphical method involves graphing both sides of an equation or inequality.
Identifying points of intersection for solutions in graphical method.
Example of solving 2x + 3 = 8 graphically and finding intersection at (2,1).
Demonstration of solving 3x - 5 = -x + 3 both algebraically and graphically.
Explanation of plotting linear equations for graphical solution.
Graphical solution of 3x - 5 = -x + 3 resulting in x = 2.
Difference between algebraic and graphical approaches to inequalities.
Graphical method for inequalities involves finding overlapping areas.
Solving a quadratic inequality graphically with a square root function.
Domain limitations for square root functions in inequalities.
Identifying the interval from 1 to 3.11 where the quadratic is less than the square root.
Explanation of including and excluding points in interval notation.
Zeroing out an equation to find when it is less than or equal to zero.
Same solution set for zeroed equation despite the change in representation.
Graphical representation of the solution set for the zeroed equation.
Transcripts

5.0 / 5 (0 votes)
Thanks for rating: