7.4.2 Systems of Inequalities
TLDRThis video tutorial delves into solving systems of inequalities by examining a specific example. The presenter graphically illustrates the process of identifying the solution set by plotting inequalities on a coordinate plane, using test points for verification, and shading the areas that satisfy all conditions. The methodical approach of isolating variables and the step-by-step explanation makes it easy for viewers to understand how to find the intersection of multiple inequalities, ultimately revealing the solution set in the first quadrant.
Takeaways
- 📈 To solve a system of inequalities, find the ordered pair (x, y) that satisfies all inequalities simultaneously.
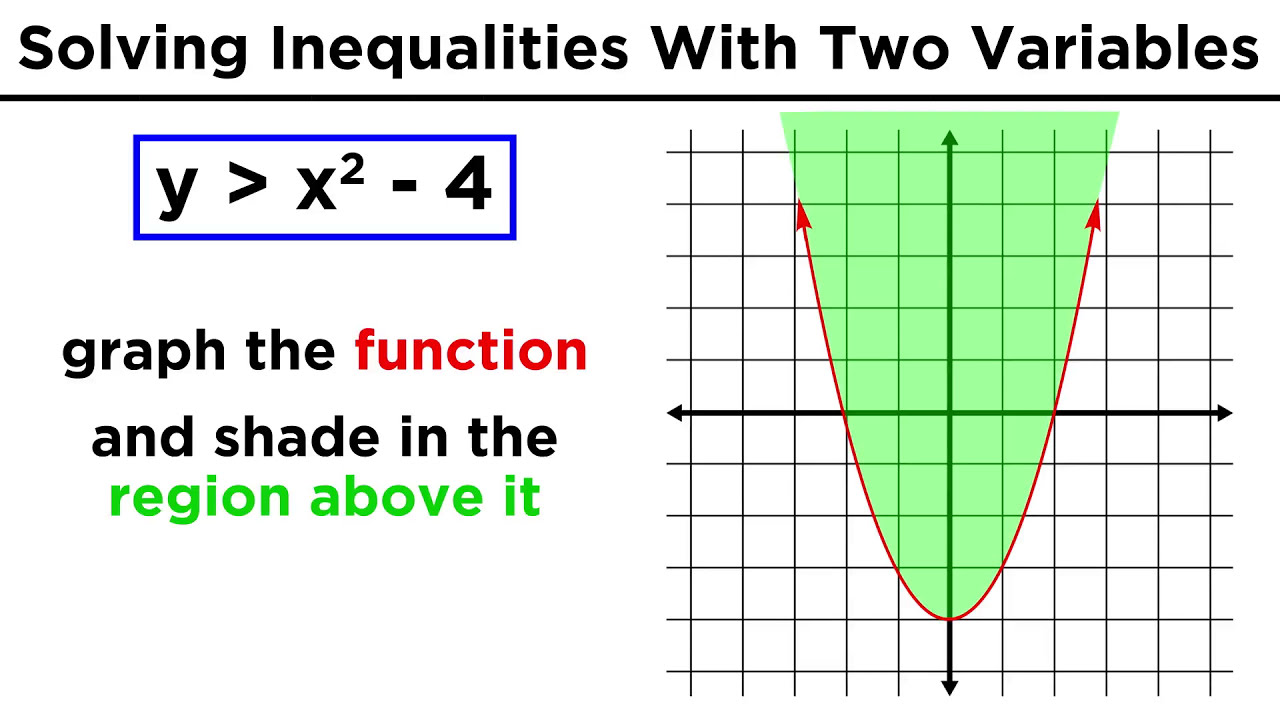
- 🔍 When graphing y > x^2, start by treating it as y = x^2 to find points, then use a test point to determine the correct shading.
- 🟫 Shade the region under the parabola (y > x^2) with a dotted line since there's no equality sign.
- 📊 For the inequality 2x + 3y < 4, isolate y to graph it as y = -2/3x + 4/3 and use a test point to shade the correct side.
- 🔴🔵 Identify the common shaded area between the two inequalities as the solution set.
- 🌟 When graphing multiple inequalities, consider the quadrants where the solution set might lie to simplify the process.
- 🛑 For inequalities with ≥ or ≤, graph as equalities first to find the intercepts and determine the line's position relative to the axes.
- 🔎 Use test points to determine which side of the line to shade for each inequality.
- 🟠🟡🟢 Find the overlapping regions in the first quadrant for inequalities x ≥ 0, y ≥ 0, y ≤ -2x + 10, and y ≤ -2/3x + 14/3.
- 🔍 The final solution set is the intersection of all shaded regions, representing where the inequalities overlap.
- 🎓 Understanding the graphical representation of inequalities and their solution sets is crucial for solving systems of inequalities.
Q & A
What is the definition of a solution for a system of inequalities?
-A solution for a system of inequalities is an ordered pair (x, y) that satisfies each of the inequalities in the system.
How do you initially graph the inequality y > x^2?
-To graph y > x^2 initially, you treat it as an equality, y = x^2, and plot points by substituting values for x to find corresponding y values.
Why is the line y = x^2 a dotted line instead of a solid line when graphing the inequality y > x^2?
-The line y = x^2 is a dotted line because the inequality does not have an equality sign, indicating that the exact points on the parabola are not part of the solution set, only the points above the parabola are.
How do you find the solution set for the system with the inequalities y > x^2 and 2x + 3y < 4?
-The solution set is found by shading the area that satisfies both inequalities, which in this case is the region above the red dotted line (y > x^2) and below the blue dotted line (2x + 3y < 4).
What is the slope of the line in the inequality y ≤ -2/3x + 4/3?
-The slope of the line for the inequality y ≤ -2/3x + 4/3 is -2/3.
How do you determine the y-intercept of the line in the inequality y ≤ -2/3x + 14/3?
-The y-intercept can be found by setting x to zero in the inequality. This gives y = -2/3(0) + 14/3, which simplifies to y = 14/3.
What is the purpose of graphing the first two inequalities in the different quadrants before focusing on the first quadrant?
-Graphing the first two inequalities in different quadrants helps to identify the overall region of the solution set before focusing on the first quadrant, which simplifies the process of finding the common points between all four inequalities.
Why is the region of the solution set for the four inequalities shaded in bright pink?
-The region is shaded in bright pink to represent the overlap of all four inequalities, which defines the final solution set for the system.
How do you test a point to see if it satisfies an inequality?
-You substitute the coordinates of the point into the inequality and check if the relationship holds true. If it does, the point is part of the solution set.
What is the significance of the axes in the solution set for a system of inequalities?
-The axes act as boundaries that limit the region of the solution set. In the given example, the axes help define the triangular region in the first quadrant where all inequalities are satisfied.
Outlines
📚 Introduction to Systems of Inequalities
This paragraph introduces the concept of systems of inequalities, explaining that they involve solving for more than one inequality simultaneously. The solution is an ordered pair (x, y) that satisfies all inequalities in the system. The video uses an example involving two inequalities, y > x^2 and 2x + 3y < 4, to demonstrate the process of graphing and finding the solution set. The first inequality is graphed by treating it as an equation (y = x^2) and then adjusting for the inequality's direction. The second inequality is isolated for y and graphed in a similar manner. The solution set is found by identifying the common shaded area between the two inequalities' graphs.
📈 Graphing Four Inequalities in the First Quadrant
This paragraph continues the discussion on systems of inequalities by introducing four inequalities to be graphed and solved. The first two inequalities, x ≥ 0 and y ≥ 0, are graphed as vertical and horizontal lines, respectively, with the solution set found in the first quadrant. The remaining two inequalities, y ≤ -2x + 10 and y ≤ -2/3x + 14⅓, are transformed into y = mx + b form to find their graphs. The solution set for the entire system is determined by identifying the overlapping region in the first quadrant where all inequalities are satisfied simultaneously. The video concludes by summarizing the process and encouraging further exploration of these concepts.
Mindmap
Keywords
💡System of Inequalities
💡Ordered Pair
💡Graphing
💡Parabolas
💡Slope
💡Y-Intercept
💡Test Point
💡Shading
💡Solution Set
💡First Quadrant
💡Intersection
Highlights
The video discusses systems of inequalities, which involve solving multiple inequalities at the same time.
A solution for a system of inequalities is an ordered pair (x, y) that satisfies each inequality in the system.
The video demonstrates graphing the inequality y > x^2, starting by treating it as an equation y = x^2 to find points on the curve.
The host uses the point (0, 1) as a test point for the inequality y > x^2, as (0, 0) is not allowed due to the parabola passing through the origin.
The video explains that the region satisfying y > x^2 is shaded inside the parabola, using a dotted line for the graph because it's not an equality.
The second inequality is 2x + 3y < 4, which is graphed by first isolating y and then finding the y-intercept and slope.
The line for 2x + 3y < 4 is drawn with a dotted line, and the region below the line is shaded to represent the solution set.
The solution set for the system is the overlap of the shaded areas from both inequalities, which in this case is a small region in the first quadrant.
The video then introduces a system with four inequalities, starting with x ≥ 0 and y ≥ 0, graphed as vertical and horizontal lines respectively.
The first quadrant is identified as the region where the solution set for the four inequalities will be found due to the overlap of the previous two inequalities.
The third inequality, y ≤ -2x + 10, is graphed with a solid line since the inequality includes an equals sign, and a triangular region is shaded below the line.
The fourth inequality, y ≤ -2/3x + 14/3, is also graphed with a solid line, and a region is shaded below the line, bounded by the axes from previous inequalities.
The final solution set is found by identifying the overlap of all four shaded regions in the first quadrant, represented by a bright pink shading.
The video concludes by summarizing that the pink-shaded region in the first quadrant is the solution set for the entire system of inequalities.
The method demonstrated in the video is a practical application of solving systems of inequalities, which can be useful in various mathematical and real-world problems.
The video provides a clear and step-by-step approach to graphing and solving systems of inequalities, which can be beneficial for educational purposes.
Transcripts

5.0 / 5 (0 votes)
Thanks for rating: