ILLUSTRATING THE SYSTEM OF NONLINEAR EQUATIONS || PRECALCULUS
TLDRThis video tutorial delves into the process of illustrating systems of non-linear equations. It begins by defining linear and non-linear equations, providing examples and distinguishing between them. The video then explains that a system of non-linear equations involves at least one non-linear equation and can be composed of both first and second-degree equations. It details the possible solutions based on the number of intersection points when graphing, such as no solution, one solution, or multiple solutions. The tutorial uses Desmos, an online graphing application, to demonstrate how to graph and find solutions for various systems of non-linear equations, including circles, ellipses, parabolas, and hyperbolas. The presenter guides viewers through each step, from entering equations to interpreting the graphical results, ultimately providing a comprehensive guide to solving and visualizing complex systems of equations.
Takeaways
- 📚 The video lesson is about illustrating systems of non-linear equations.
- 🔍 A non-linear equation is characterized by having at least one equation that is not linear, such as quadratic or higher degree equations.
- 📈 Linear equations are in the form of 'ax + by + c = 0', and examples include 'x + y = 10' and '4x + 2y = 26'.
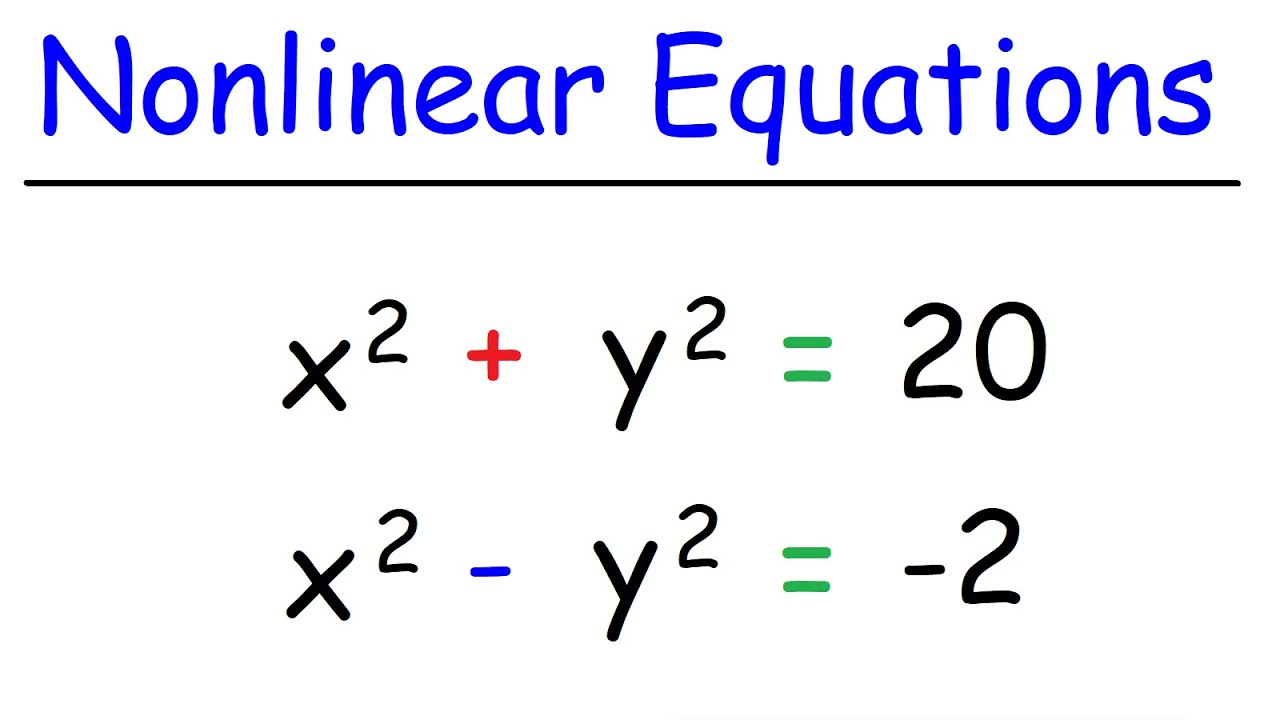
- 📉 Non-linear equations can be first or second degree, and examples given include 'x^2 + y^2 - 8x - 4y = -7' and 'x^2 + y = 2'.
- 🧩 The solution to a system of non-linear equations can be determined by the number of points of intersection when graphed.
- 🤔 The number of solutions to a system of non-linear equations can range from no solution to multiple solutions, depending on the intersection points.
- 🔍 The video discusses possible intersections between different types of curves, such as parabolas, lines, circles, ellipses, and hyperbolas.
- 📝 Desmos, an online graphing application, is recommended for illustrating and solving systems of non-linear equations.
- 💻 The video provides a step-by-step guide on how to input equations into Desmos to find the points of intersection.
- 📈 Desmos can be used to visualize the intersections between different equations, such as a circle and a line, or a parabola and a hyperbola.
- 👍 The video concludes with a summary of the solutions found for the given systems of non-linear equations, highlighting the number of intersections and solutions.
Q & A
What is a non-linear equation?
-A non-linear equation is an equation that contains terms with variables raised to a power higher than one, or terms involving products or ratios of variables. It is not a polynomial equation of degree one.
What is the difference between a linear equation and a non-linear equation?
-A linear equation is a polynomial equation of degree one, meaning it involves only the first power of the variables and no products or ratios of variables. A non-linear equation, on the other hand, involves variables raised to a power higher than one or includes products and ratios of variables.
What is the general form of a linear equation in two variables?
-The general form of a linear equation in two variables is 'ax + by + c = 0', where 'a', 'b', and 'c' are constants, and 'x' and 'y' are the variables.
Can you provide an example of a non-linear equation?
-An example of a non-linear equation is 'x^2 + y^2 - 8x - 4y = -7', which represents a combination of a quadratic term and linear terms.
What is a system of non-linear equations?
-A system of non-linear equations is a set of two or more equations in two or more variables where at least one equation is non-linear, meaning it contains terms with variables raised to a power higher than one or terms involving products or ratios of variables.
How can the solutions of a system of non-linear equations be determined?
-The solutions of a system of non-linear equations can be determined by graphing the equations and observing the points of intersection. The number of intersection points corresponds to the number of solutions.
What are the possible types of solutions for the intersection of a parabola and a line?
-The possible types of solutions for the intersection of a parabola and a line are: no intersection (no solution), intersect at one point (one solution), and intersect at two points (two solutions).
How can Desmos be used to illustrate a system of non-linear equations?
-Desmos is a graphing application that can be used to plot the equations of a system of non-linear equations. By entering the equations into Desmos, you can visualize the graphs and determine the points of intersection, which represent the solutions to the system.
What is the significance of the number of intersection points in determining the number of solutions for a system of non-linear equations?
-The number of intersection points between the graphs of the equations in a system directly corresponds to the number of solutions for that system. No intersection points mean no solutions, one intersection point means one solution, and so on.
Can you provide an example of how to use Desmos to find the solutions of a given system of non-linear equations?
-To use Desmos, you would open the application or go to desmos.com/calculator, enter the equations of the system one by one, and then observe the points of intersection on the graph. For example, if you have the equations 'x^2 + y^2 = 10' and 'x - 3y = 0', you would enter these into Desmos and look for where the graphs intersect.
Outlines
📚 Introduction to Non-Linear Equations
This paragraph introduces the concept of non-linear equations and contrasts them with linear equations. It provides examples of both types of equations, including a linear equation in the form of ax + by + c = 0 and non-linear equations like x^2 + y^2 = 10 and x^2 - 3y = -10. The paragraph also explains that a system of non-linear equations involves at least one non-linear equation and can include both first and second-degree equations. The solutions to such a system are determined by the number of intersection points when graphed, which can range from no solution to multiple solutions depending on the equations involved.
📈 Graphing Systems of Non-Linear Equations
This section explains how to graph systems of non-linear equations to find their solutions. It discusses the possible intersection scenarios between parabolas, lines, circles, and ellipses, such as no intersection, tangent (one solution), and crossing at multiple points (two or more solutions). The paragraph also mentions using Desmos, an online graphing application, to visualize and solve these systems. It provides a step-by-step guide on entering equations into Desmos, starting with a circle and a linear equation, and then moving on to more complex scenarios like a parabola intersecting with a line at one point.
📘 Detailed Steps for Using Desmos
This paragraph delves deeper into the process of using Desmos to graph and solve systems of non-linear equations. It provides specific instructions for entering different types of equations, such as linear, circle, parabola, and ellipse equations, into Desmos. The paragraph also illustrates how to identify and label intersection points, which are crucial for determining the solutions to the system. It guides the viewer through entering equations step by step, including how to label them for clarity, and how to interpret the graphical output to find the number of solutions.
🔍 Analyzing Intersections and Solutions
The final paragraph summarizes the process of analyzing the intersections of different types of curves to determine the number of solutions for a given system of non-linear equations. It reviews the various scenarios, such as no intersection, one intersection point, and multiple intersection points, and how these relate to the solutions of the system. The paragraph also provides examples of specific equations and their intersection points, such as a circle and a parabola intersecting at one point, or an ellipse and a hyperbola having no intersection. The summary concludes with a call to action for viewers to like, subscribe, and follow for more educational content.
Mindmap
Keywords
💡Non-linear equations
💡Linear equations
💡System of equations
💡Intersection points
💡Parabola
💡Hyperbola
💡Ellipse
💡Desmos
💡Tangent
💡Solution
Highlights
Introduction to the concept of non-linear equations and their distinction from linear equations.
Explanation of how to format a linear equation in the form of \( ax + by + c = 0 \).
Presentation of various forms of non-linear equations, including ellipse, hyperbola, and parabola.
Illustration of the system of non-linear equations and its components.
Description of how the solution of a system of non-linear equations can be determined by the number of points of intersection.
Different possible types of solutions for the intersection of a parabola and a line.
Explanation of scenarios where a line will not intersect a hyperbola, indicating no solution.
Discussion on the conditions when a line is tangent to a parabola, resulting in exactly one solution.
Analysis of the intersection of a line and a parabola at two points, indicating two solutions.
Clarification on the impossibility of a line intersecting a circle in certain conditions.
Demonstration of a line being tangent to a circle, resulting in one solution.
Explanation of scenarios where a line intersects a circle at two points, leading to two solutions.
Introduction to the concept of an ellipse and its intersection with a circle, with different outcomes.
Guidance on using Desmos application to graph and solve systems of non-linear equations.
Step-by-step tutorial on inputting equations into Desmos and interpreting the graphical solutions.
Example of determining the solution for a system involving a circle and a linear equation.
Illustration of a parabola intersecting with a line at one point, showcasing one solution.
Demonstration of a system involving a circle and a parabola intersecting at specific points.
Analysis of a system with a circle and an ellipse, explaining the possible number of intersections.
Conclusion summarizing the different types of solutions for systems of non-linear equations.
Encouragement for viewers to like, subscribe, and follow for more math tutorial videos.
Transcripts
Browse More Related Video
How To Solve Systems of Nonlinear Equations

SOLVING SYSYEM OF NONLINEAR EQUATIONS || PRECALCULUS

PROBLEMS INVOLVING SYSTEM OF NONLINEAR EQUATIONS || PRECALCULUS

Ch. 10.1 Systems of Linear Equations in Two Variables

Pre Calculus - Solving System of Nonlinear Equations | Systems of Equations
Ch. 10.2 Systems of Linear Equations in Several Variables
5.0 / 5 (0 votes)
Thanks for rating: