SPSS (9): Mean Comparison Tests | T-tests, ANOVA & Post-Hoc tests
TLDRThis video tutorial explores mean comparison techniques in SPSS, guiding viewers through various statistical tests for analyzing group data. It covers calculating group means, one-sample t-tests for hypothesis testing, independent samples t-tests for comparing two groups, and one-way ANOVA for more than two groups. The video also touches on post hoc tests for ANOVA and paired sample t-tests for repeated measures. The presenter illustrates each method using SPSS, providing a practical understanding of statistical analysis for researchers and students alike.
Takeaways
- 📊 The video introduces various mean comparison options in SPSS for analyzing data across multiple groups.
- 🔢 The 'Means' option in SPSS provides the average scores of different groups but does not allow for hypothesis testing.
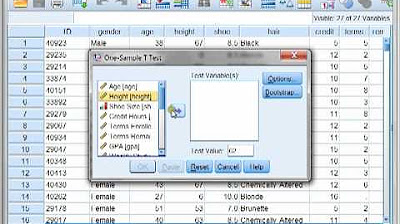
- 📈 To compare a group's mean to a hypothesized value, one can use the 'One Sample T-Test', which checks for significant differences.
- 👥 The 'Independent Samples T-Test' is used to compare the means of two different groups, assuming equal variances.
- 📚 For comparing the means of more than two groups, 'One-Way ANOVA' is the appropriate method, which can reveal significant differences among the groups.
- 📋 The video demonstrates how to use 'Layer 1' to categorize the mean of different variables for a categorical variable, such as gender.
- 🔍 The 'Levene's Test for Equality of Variances' is conducted by default in SPSS to check the assumption of equal variances among groups.
- 📉 If the assumption of equal variances is violated, the results from the 'Independent Samples T-Test' may differ, leading to different interpretations.
- 🔄 'Paired Sample T-Test' is utilized when data is collected repeatedly from the same sample to identify significant changes over time.
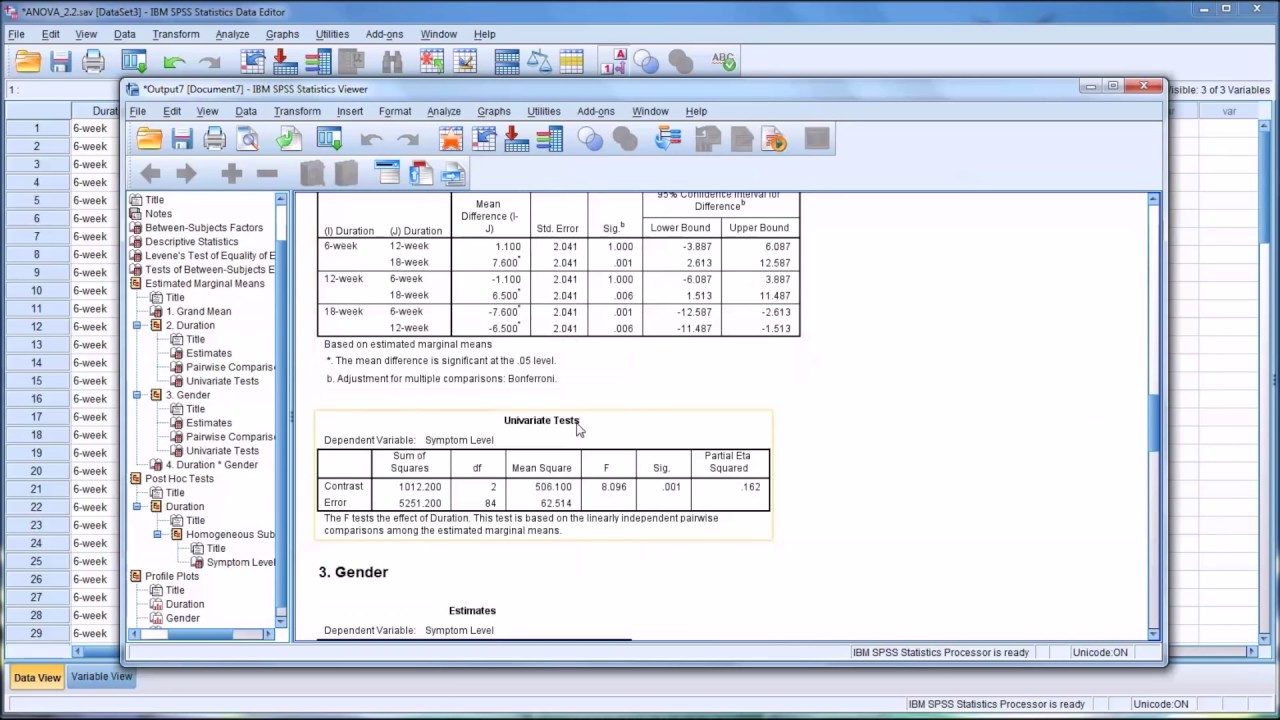
- 📝 Post hoc tests, such as Tukey's HSD, can be performed after ANOVA to determine which specific groups differ significantly from each other.
- 📉 The significance value in ANOVA indicates that there is a difference between at least two groups, but does not specify which groups are different without further analysis.
Q & A
What is the main topic of the video?
-The main topic of the video is explaining the mean comparison options in SPSS, which includes various statistical tests for analyzing differences between group means.
What is the purpose of mean comparison in statistical analysis?
-The purpose of mean comparison is to determine if there is a significant difference between the mean scores of multiple groups, which can help in hypothesis testing.
What is the 'Means' option in SPSS and what does it provide?
-The 'Means' option in SPSS provides the average scores of multiple groups but does not allow for hypothesis testing based on these means alone.
How can you categorize the mean of different variables for a categorical variable in SPSS?
-You can categorize the mean of different variables for a categorical variable by using the 'Layer' option in SPSS, which allows you to see the mean for each category of the variable.
What is a one-sample t-test and when is it used in SPSS?
-A one-sample t-test is used to compare the mean of one group with a hypothesized number. It is used when you want to determine if the mean of a group significantly differs from a specific value.
What does the output of a one-sample t-test in SPSS include?
-The output of a one-sample t-test includes the t-score, degrees of freedom, significance level, confidence interval for the difference, and the mean difference between the group and the hypothesized value.
What is the difference between an independent samples t-test and a paired sample t-test?
-An independent samples t-test is used to compare the means of two different groups, while a paired sample t-test is used when data is collected repeatedly from the same sample or subjects.
What is the assumption made by Levene's test for equality of variances in SPSS?
-Levene's test assumes that the variances of the groups being compared are equal. The test result helps determine if this assumption holds true, which is important for the validity of subsequent t-tests.
What is one-way ANOVA used for in SPSS?
-One-way ANOVA is used to compare the means of more than two groups to determine if there is a significant difference between at least two of the groups.
What is the purpose of post hoc tests in ANOVA?
-Post hoc tests are used after a significant ANOVA result to determine which specific groups differ from each other, providing more detailed information about the sources of significant differences.
How can you interpret the results of a paired sample t-test in SPSS?
-The results of a paired sample t-test show whether there is a significant difference between the means of the same group measured at two different times or conditions. The t-value, degrees of freedom, and confidence intervals help in this interpretation.
Outlines
📊 Mean Comparisons in SPSS
This paragraph introduces the concept of mean comparisons in SPSS, which is used to analyze if there is a significant difference between the mean scores of multiple groups. The speaker explains that the 'Means' option in SPSS provides the average scores but does not allow for hypothesis testing. An example is given using two continuous variables from a dataset, showing how to obtain the mean scores for different groups. Additionally, the 'Layer' feature is discussed, which allows for the mean comparison across different variables based on a categorical variable, such as gender.
🔍 Hypothesis Testing with T-tests
The second paragraph delves into hypothesis testing using one sample t-test and independent samples t-test in SPSS. The one sample t-test is used to compare the mean of a group with a hypothesized value, as demonstrated with a reading score example. The output includes the t-score, degrees of freedom, and confidence interval for the difference. The independent samples t-test is then explained for comparing the means of two different groups, using gender as a grouping variable. The results include the Levene's test for equality of variances and the t-test statistics to determine if there is a significant difference between the groups.
📚 One-Way ANOVA for Multiple Groups
This paragraph explains the use of one-way ANOVA in SPSS for comparing the means of more than two groups. An example with three categories of a 'program' variable is given, and the ANOVA output is discussed, including the sum of squares, degrees of freedom, F-statistics, and significance. The significance value indicates a difference between at least two groups, but does not specify which groups. Post hoc tests, such as Tukey's HSD, are suggested for further analysis to identify specific group differences.
🔄 Paired Sample T-Test for Repeated Measures
The final paragraph discusses the paired sample t-test, which is used when data is collected from the same sample multiple times. Although the speaker acknowledges the lack of a repeated measures variable in the dataset, they demonstrate the process using a hypothetical scenario where reading scores from 2018 and 2019 are compared. The output shows the mean difference, standard error, and t-value, concluding that there is no significant difference between the two years' scores.
Mindmap
Keywords
💡Mean Comparisons
💡MENA Score
💡SPSS
💡Dependent List
💡Continuous Variables
💡Hypothesis Testing
💡One Sample T-Test
💡Independent Samples T-Test
💡One-Way ANOVA
💡Post Hoc Tests
💡Paired Sample T-Test
Highlights
Introduction to mean comparison options in SPSS for analyzing multiple groups and their mean scores.
Explanation of when to use mean comparison methods and the significance of hypothesis testing in statistical analysis.
Demonstration of how to use the 'Means' option in SPSS to obtain the average scores of multiple groups.
Illustration of calculating means with continuous variables using an example dataset.
How to interpret the output of the 'Means' option, including mean scores, standard deviations, and number of observations.
Using the 'Means' option to compare means across different variables for a categorical variable, such as gender.
Description of the 'One Sample t-Test' for comparing a group's mean with a hypothesized value.
Step-by-step guide on how to perform a one sample t-test in SPSS and interpret the results.
Clarification of the conditions under which to use the 'Independent Samples t-Test' for comparing two different groups.
Explanation of the assumptions behind the 'Independent Samples t-Test', including equal variances across groups.
How to conduct and interpret the results of the 'Independent Samples t-Test' using SPSS.
Introduction to 'One-Way ANOVA' for comparing the means of more than two groups.
Guidance on performing a one-way ANOVA in SPSS and understanding its significance value.
Use of post hoc tests in SPSS to determine which groups differ significantly after a significant ANOVA result.
Application of 'Paired Sample t-Test' for analyzing repeated measures data from the same sample over time.
How to set up and interpret the results of a paired sample t-test in SPSS.
Summary of the different mean comparison tests in SPSS: mean, one sample t-test, independent samples t-test, paired sample t-test, and one-way ANOVA.
Conclusion and call to action for viewers to like, comment, share, and subscribe for more informative content.
Transcripts
Browse More Related Video
Three Different t tests using SPSS with Dr Ami Gates
Understanding Analysis of Variance (ANOVA) including Excel - Statistics Help
One sample t-test vs Independent t-test vs Paired t-test

t-Test - Full Course - Everything you need to know
Conducting a Two-Way ANOVA in SPSS

How To Know Which Statistical Test To Use For Hypothesis Testing
5.0 / 5 (0 votes)
Thanks for rating: