One-way ANOVA & Post-Hoc Analysis in Excel
TLDRThis instructional video demonstrates how to perform a one-way ANOVA in Excel to determine if there are significant differences in means among multiple groups. It uses a dataset of athletes' isometric peak force across three sports. After explaining the process and significance of ANOVA, the video guides viewers through post-hoc Bonferroni adjusted pairwise comparisons to identify specific group differences, ensuring a clear understanding of statistical analysis in sports science.
Takeaways
- 📊 The video demonstrates how to perform a one-way ANOVA (Analysis of Variance) in Excel to determine if there are differences in means among multiple groups.
- 🔍 The context of the analysis involves comparing the isometric peak force (IPF) among three groups of athletes: tennis, football, and basketball players.
- 📈 The video explains that a one-way ANOVA is used when there are more than two groups and the goal is to assess whether the groups come from the same population.
- 🤔 It's important to note that ANOVA does not specify which groups are different; it only indicates if there is a difference somewhere among the groups.
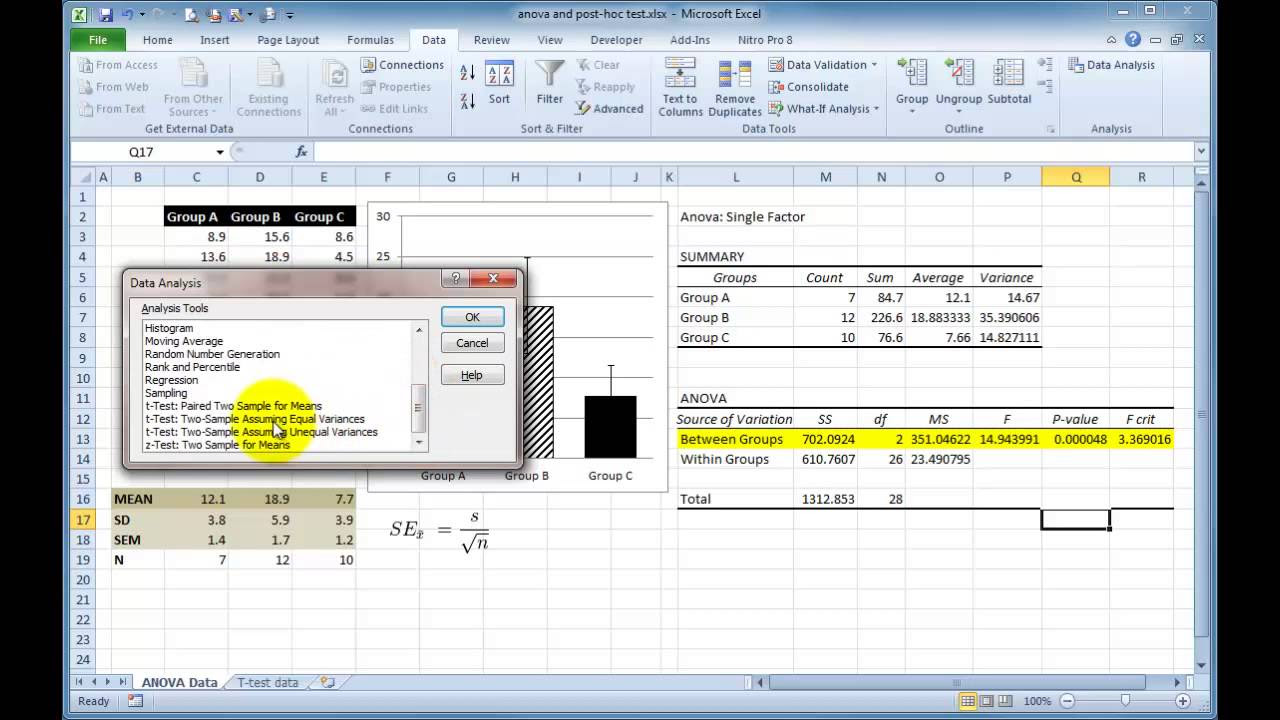
- 📝 The script provides a step-by-step guide on how to arrange the data in Excel, highlighting the need to separate data by groups due to Excel's limitations.
- 📉 The descriptive statistics table generated by Excel is used to compare the average IPF among the different sports groups, with football players showing the highest average.
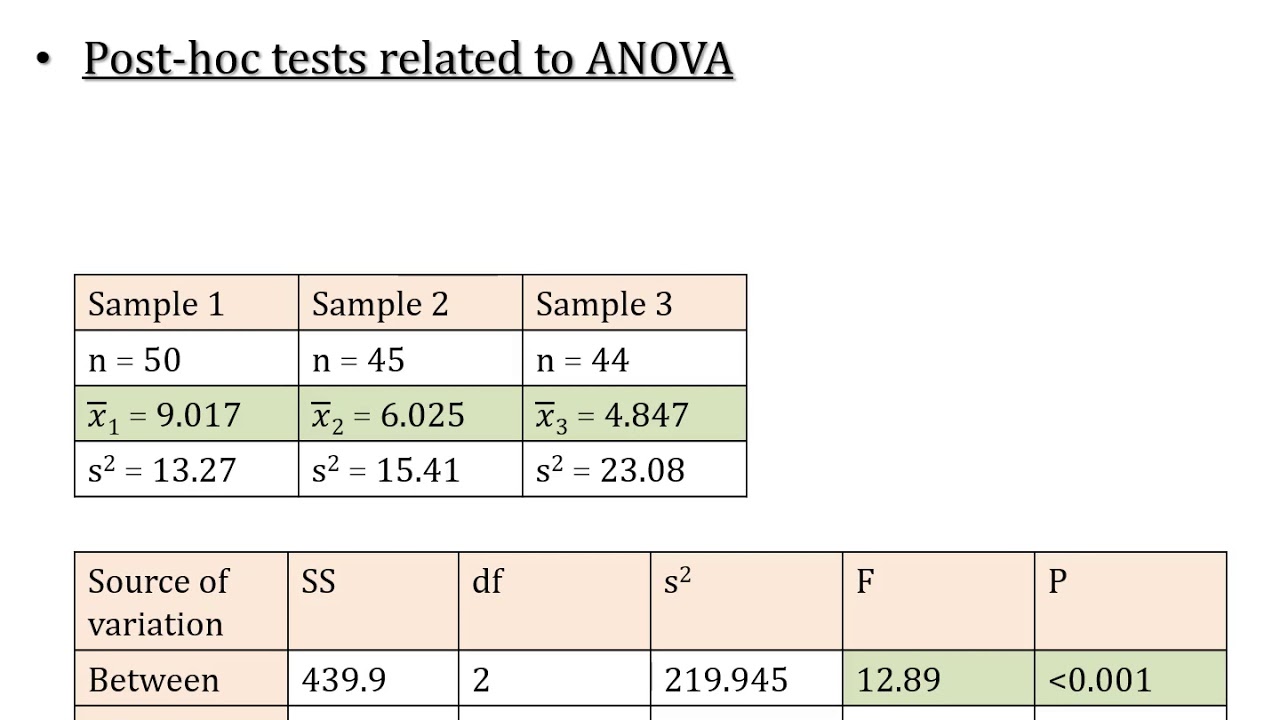
- 📊 The ANOVA table in Excel provides the sum of squares, degrees of freedom, mean squares, and the F value, which is used to determine statistical significance.
- 🔑 A significant F value and a small p-value from the ANOVA indicate that there is a difference among the groups, but further analysis is needed to pinpoint which groups differ.
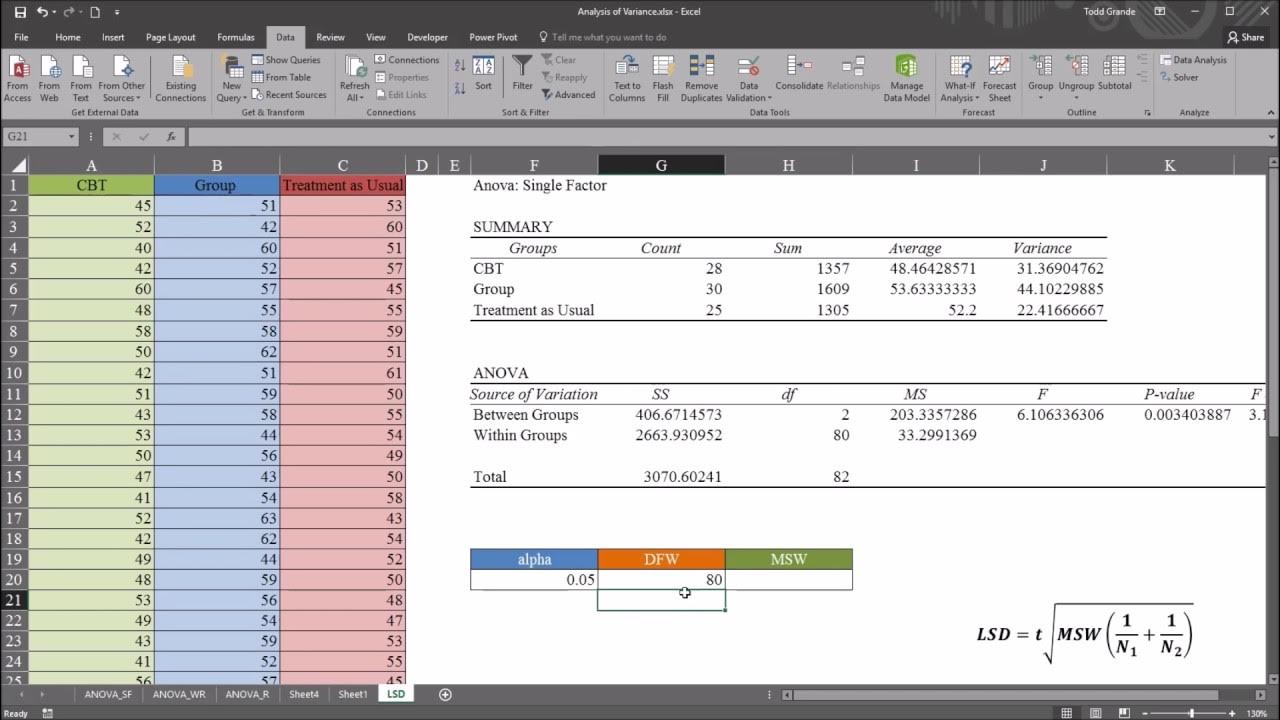
- 🔍 Post-hoc analysis, specifically pairwise comparisons with a Bonferroni adjustment, is recommended to control for family-wise error when multiple comparisons are made.
- 📐 The Bonferroni correction is applied by dividing the alpha level (0.05) by the number of comparisons to reduce the chance of a Type I error.
- 📝 The video concludes with the results of the pairwise comparisons, showing significant differences in IPF among all three groups of athletes even after applying the Bonferroni adjustment.
Q & A
What statistical test is being discussed in the video?
-The video discusses how to run a one-way Analysis of Variance (ANOVA) in Excel.
What is the purpose of a one-way ANOVA?
-A one-way ANOVA is used to determine if there is a statistically significant difference in means among three or more groups.
Why is a post-hoc analysis necessary after a one-way ANOVA?
-A post-hoc analysis is necessary to identify which specific groups differ from each other, as ANOVA only tells us if there is a difference somewhere among the groups.
What type of athletes are included in the dataset used in the video?
-The dataset includes tennis, football, and basketball athletes.
What does IPF stand for in the context of the video?
-IPF stands for Isometric Peak Force, a measure of the maximum force that athletes can generate isometrically.
How is isometric peak force measured in the video's dataset?
-Isometric peak force is measured in newtons, not in pounds or kilograms.
What Excel tool is used to perform a one-way ANOVA?
-The 'Data Analysis Tool Pack' in Excel is used to perform a one-way ANOVA.
What is the significance of the F value in ANOVA?
-The F value is the ratio of the between-group mean squares to the within-group mean squares, and it is used to determine if the variance between groups is significantly different from the variance within groups.
What is the Bonferroni adjustment used for in post-hoc analysis?
-The Bonferroni adjustment is used to reduce the risk of type I error (false positives) when performing multiple pairwise comparisons by dividing the alpha level by the number of comparisons.
How many pairwise comparisons are made in the video's example?
-Three pairwise comparisons are made: tennis to football, tennis to basketball, and football to basketball.
What is the new alpha level after applying the Bonferroni correction in the video?
-The new alpha level is 0.05 divided by the number of comparisons, which is 3, resulting in an alpha level of approximately 0.0167.
Outlines
📊 Running a One-Way ANOVA in Excel
This paragraph introduces a tutorial video on how to conduct a one-way ANOVA in Excel, which is used to analyze if there are significant differences in means between three or more groups. The video will also cover a post-hoc follow-up with a Bonferroni adjustment to determine which groups differ significantly from each other. The example uses data from athletes of different sports, measuring their isometric peak force, and explains the process of setting up the data in Excel, running the ANOVA test, and interpreting the results.
🔍 Post-Hoc Analysis with Bonferroni Adjustment
The second paragraph delves into the necessity of post-hoc analysis when a significant result is obtained from the ANOVA test. It explains the Bonferroni adjustment method for pairwise comparisons to control the family-wise error rate when conducting multiple tests. The video demonstrates how to perform t-tests for each pair of groups and then apply the Bonferroni correction to determine the significance of the differences between them. The results indicate significant differences in isometric peak force among the groups of athletes from different sports.
📚 Conclusion and Further Learning
The final paragraph of the script is incomplete, but it seems to be an introduction to another segment of the video or a continuation of the tutorial. It suggests that the presenter will continue to show how to perform a one-way ANOVA and possibly address more complex statistical analyses in future videos. The paragraph encourages viewers to explore further topics in kinesiology and statistics through the provided playlists.
Mindmap
Keywords
💡One-Way ANOVA
💡Post-Hoc Analysis
💡Bonferroni Adjustment
💡Isometric Peak Force (IPF)
💡Dependent Variable
💡Independent Variable
💡Descriptive Statistics
💡Sum of Squares
💡Degrees of Freedom
💡T-Test
Highlights
The video demonstrates how to conduct a one-way ANOVA in Excel with a post-hoc follow-up.
One-way ANOVAs are used when there are multiple groups to determine if there is a difference in means.
The analysis does not specify which groups differ but indicates if any groups differ from the rest.
A significant p-value and large F-value from ANOVA necessitate a post hoc analysis.
Excel is used to perform the analysis with a Bonferroni adjustment to reduce family-wise error.
The dataset consists of three groups of athletes: tennis, football, and basketball players.
IPF, or isometric peak force, is the dependent variable measured in newtons.
IPF measures the maximum force generated isometrically without changing joint angles.
The aim is to determine if there are differences in IPF among the three types of athletes.
Data must be arranged in separate columns in Excel for the ANOVA analysis.
Excel's Data Analysis Toolpak is used to perform the Single Factor ANOVA.
Descriptive statistics and averages from each group are provided by the ANOVA summary table.
The F-value and p-value from the ANOVA table indicate a statistically significant difference among the groups.
Post hoc analysis involves pairwise comparisons using t-tests with Bonferroni adjustments.
Bonferroni adjustments reduce the alpha level to decrease the chance of type 1 errors.
T-tests are conducted for each pair of athlete groups to identify specific differences.
Even with the Bonferroni adjustment, all pairwise comparisons show significant differences.
The process can be applied to datasets with more than three groups and a single independent factor.
The video will cover more complex ANOVA and post hoc analysis in future content.
Transcripts
Browse More Related Video
Performing a One-way ANOVA in Excel with post-hoc t-tests

Fisher's LSD Explained

Perform ANOVA Post-Hoc Tests (Bonferroni Correction) In Excel

Understanding Analysis of Variance (ANOVA) including Excel - Statistics Help
One-Way ANOVA with LSD (Least Significant Difference) Post Hoc Test in Excel
LSD; Least Significant Difference; Post Hoc Test of ANOVA; Comparison of Means (Part A)
5.0 / 5 (0 votes)
Thanks for rating: