ANOVA (Analysis of Variance) and Sum of Squares | Statistics Tutorial #26 | MarinStatsLectures
TLDRThe video script delves into the concept of Analysis of Variance (ANOVA), particularly focusing on the one-way ANOVA test. It explains the idea of variance analysis through a simplified example of comparing weight loss across three different diets. The script clarifies terms such as total sum of squares, explained and unexplained variance, and introduces the concepts of between-group and within-group variability. It emphasizes the importance of understanding these components to effectively conduct and interpret a one-way ANOVA test.
Takeaways
- 📊 The concept of Analysis of Variance (ANOVA) is fundamental to understanding statistical methods that involve partitioning variability in data.
- 🔍 The total sum of squares (SST) measures the overall variability in weight loss by calculating the distance of each individual from the overall mean, squared.
- 📈 The total variability in the data can be decomposed into explained (by diet) and unexplained (random) parts, leading to the concepts of 'between' and 'within' group variability.
- 🏋️♀️ The explained variability is due to differences between diets, termed 'sum of squares between', and is calculated by summing the squared differences between each group's mean and the overall mean.
- 🧘♀️ The unexplained variability is due to differences within diets, termed 'sum of squares within', and is calculated by summing the squared differences between each individual's weight loss and their group's mean.
- 🎯 The mean squared between (MSB) and mean squared within (MSW) are derived from the respective sums of squares and their degrees of freedom, providing measures of group variability.
- 🌟 The goal of ANOVA is to compare the ratio of between-group variability to within-group variability to determine if there are significant differences between the groups.
- 📚 The script emphasizes the importance of understanding the conceptual framework behind ANOVA before diving into the mathematical details and applications.
- 🔗 The terms 'explained sum of squares', 'sum of squares model', 'sum of squares treatment', and 'sum of squares regression' are often used interchangeably to describe the between-group variability.
- 🔄 The process of partitioning total variability into explained and unexplained components is akin to separating 'signal' from 'noise' in a dataset.
- 🎓 The video aims to provide a clear and simplified explanation of ANOVA concepts, using a hypothetical weight loss study with three diets as an example.
Q & A
What is the primary goal of analyzing variance in statistical methods?
-The primary goal is to understand the total variability in a dataset by breaking it down into components, such as explained and unexplained variability, to gain insights into the factors affecting the data.
How is the total sum of squares (SS total) calculated in the context of variance analysis?
-The total sum of squares is calculated by summing the squared differences between each observation and the overall mean (grand mean) of the data.
What does the overall mean (or grand mean) represent in the analysis of variance?
-The overall mean represents the average outcome across all groups in the study, ignoring the division into different groups or treatments.
How is the explained sum of squares different from the unexplained sum of squares?
-The explained sum of squares quantifies the variability due to the differences between groups (e.g., different diets), while the unexplained sum of squares quantifies the variability that cannot be attributed to group differences and is considered random or due to other factors.
Why might individuals on the same diet experience different weight loss outcomes?
-Individuals may experience different outcomes due to biological variability and other factors not related to the diet, indicating the presence of unexplained variability within the groups.
How is the variance within groups (Mean Squared Within) calculated?
-The variance within groups is calculated as the sum of squares within (sum of the squared differences between each observation and their group mean) divided by its degrees of freedom, which are determined by the total number of observations minus the number of groups.
What does the term 'degrees of freedom' refer to in the context of variance analysis?
-Degrees of freedom refer to the number of independent values or quantities which can vary in the analysis. It is used to normalize the sum of squares in variance calculations, accounting for the number of groups or parameters estimated.
Why are the terms 'between group variability' and 'within group variability' significant in ANOVA?
-These terms are significant because they represent the two main components of variability being analyzed: the variability due to differences between groups (explained) and the variability within each group (unexplained), which are crucial for understanding the effects being studied.
What role does the concept of signal and noise play in the analysis of variance?
-In the context of variance analysis, 'signal' refers to the variability explained by the factors under study (e.g., different diets), while 'noise' refers to the unexplained variability. Separating these helps in assessing the effectiveness of the treatments.
How is the test statistic for one-way ANOVA constructed?
-The test statistic for one-way ANOVA is constructed by comparing the variance between groups to the variance within groups, typically by taking the ratio of these variances to determine if there are significant differences between the groups.
Outlines
📊 Introduction to Analysis of Variance (ANOVA)
This paragraph introduces the concept of Analysis of Variance (ANOVA), emphasizing its widespread use in statistical methods. It explains the need for a solid understanding of terms like 'variability', 'sums of squares', and the distinction between 'explained' and 'unexplained' sums of squares. The paragraph uses a simplified example of comparing weight loss across three diets with three observations each to illustrate the concept. It introduces the idea of the 'total sum of squares', which measures the overall variability in weight loss by calculating the distance of each individual from the overall mean and squaring these distances. The paragraph aims to build a foundation for further understanding of ANOVA.
🔍 Separating Variability: Explained and Unexplained
This paragraph delves into the reasons behind variability in weight loss among individuals, even when following the same diet. It introduces the concept of 'explained' variability, which is attributed to differences between diets, and 'unexplained' variability, which is due to factors other than diet, such as biological differences. The paragraph explains how total variability can be divided into these two parts and introduces the terms 'Between (group) variability' for explained variability and 'Within (group) variability' for unexplained variability. It sets the stage for understanding how these concepts are graphically and algebraically separated in ANOVA.
📈 Mathematical Breakdown of Total Sum of Squares
This paragraph provides a mathematical breakdown of the total sum of squares, explaining how it can be separated into 'sum of squares between groups' and 'sum of squares within groups'. It defines these terms as 'explained' and 'unexplained' variability, respectively. The paragraph describes the calculation of the sample variance for the total, between groups, and within groups, including the division by their respective degrees of freedom. It emphasizes the importance of understanding these components to build the test statistic for one-way ANOVA and compares them to signal and noise concepts.
🎯 Conclusion and Terminology Clarification
The paragraph concludes by clarifying various terms used for 'sum of squares between groups' and 'sum of squares within groups', such as 'explained sum of squares', 'sum of squares model', 'sum of squares treatment', 'sum of squares regression', 'sum squared error', and 'sum squared residual'. It highlights the importance of recognizing these terms when consulting different sources. The paragraph also notes a slight flaw in the graphical representation of the concept, where the squared distances do not visually add up as expected but mathematically do. It ends by reiterating the goal of ANOVA, which is to compare the variability between and within groups to build the test statistic.
Mindmap
Keywords
💡Analysis of Variance (ANOVA)
💡Sum of Squares
💡Grand Mean
💡Total Sum of Squares
💡Between-Group Variability
💡Within-Group Variability
💡Degrees of Freedom
💡Sample Variance
💡Explained Variability
💡Unexplained Variability
Highlights
The concept of analysis of variance (ANOVA) is introduced, emphasizing its importance in various statistical methods.
Explaining variance analysis involves understanding sums of squares, both explained and unexplained.
A simplified example is used to illustrate the concept, comparing weight loss across three diets with three observations each.
The overall mean or grand mean is calculated as the average weight loss across all individuals, irrespective of their diet group.
Total sum of squares is introduced as a measure of total variability in weight loss, calculated by the distance of each individual from the overall mean.
The concept of explained variance is introduced, attributing differences in weight loss to the effectiveness of the diets.
Unexplained variance is discussed, which refers to the random variability in weight loss not attributable to diet.
The total variability in weight loss can be separated into explained (between groups) and unexplained (within groups) variance.
Sum of squares between (group mean from overall mean squared) is used to quantify explained variance due to diet differences.
Sum of squares within (individual from group mean squared) measures the unexplained variance within each diet group.
The terms 'explained' and 'unexplained' are sometimes replaced with 'between' and 'within' group variability in the context of ANOVA.
Different names are used in various sources for the same concepts, such as 'Mean Squared Between' for explained variance and 'Mean Squared Within' for unexplained variance.
The total sum of squares mathematically equals the sum of squares between plus the sum of squares within when considering all observations.
The concept of signal and noise is applied to the explained and unexplained variance, respectively, in the context of ANOVA.
The process of building up the test statistic for one-way ANOVA involves comparing the variability between groups to the variability within groups.
The video aims to provide a conceptual understanding of ANOVA, setting the stage for further statistical analysis.
Transcripts
Browse More Related Video
ANOVA Part III: F Statistic and P Value | Statistics Tutorial #27 | MarinStatsLectures

ANOVA (Analysis of variance) simply explained

ANOVA: One-way analysis of variance

One way ANOVA using Excel(one way anova)(ANOVA)(anova)(excel)(EXCEL)

ANOVA 2: Calculating SSW and SSB (total sum of squares within and between) | Khan Academy
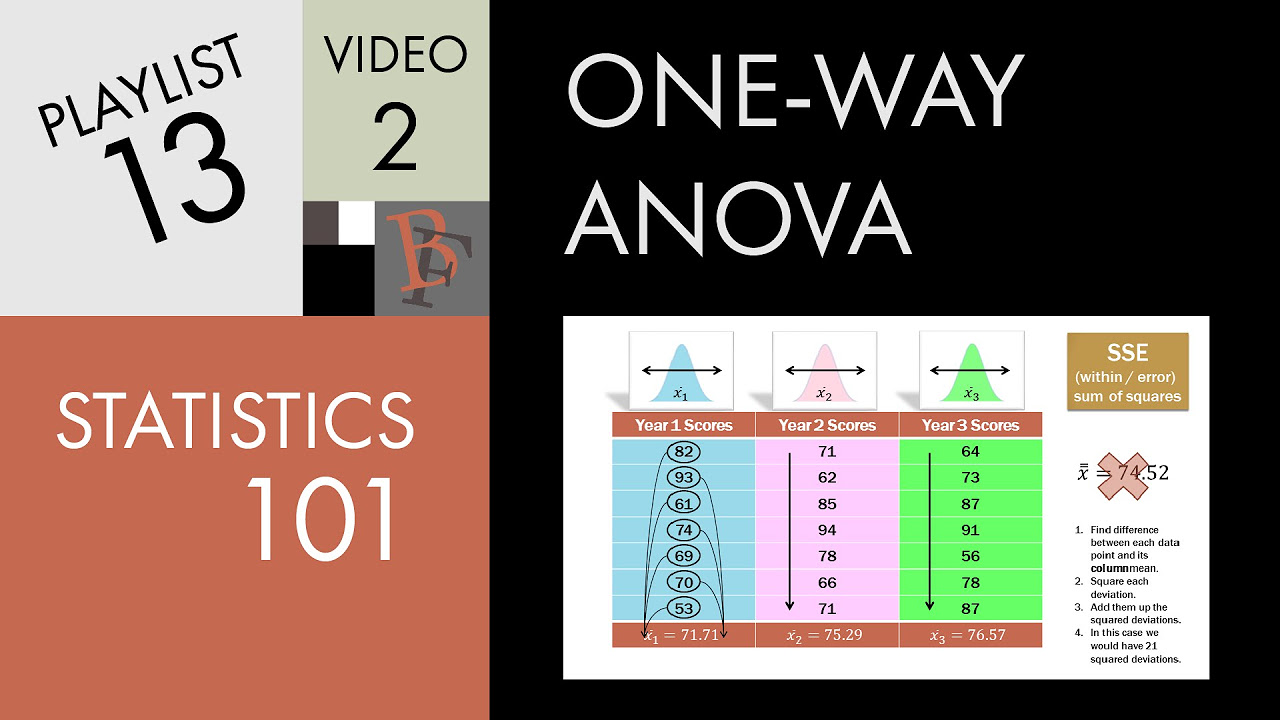
Statistics 101: One-way ANOVA, A Visual Tutorial
5.0 / 5 (0 votes)
Thanks for rating: