How to Run One Way ANOVA in SPSS: Concept, Interpretation, and Reporting One Way ANOVA
TLDRThis tutorial delves into conducting and interpreting One-Way ANOVA using SPSS, a statistical method for comparing means across three or more groups. It covers hypothesis testing, assumptions like homogeneity of variance, and post-hoc analysis with Tukey's HSD. The example of evaluating organizational commitment across different management levels illustrates the process, from hypothesis formulation to reporting results, including significant differences between groups and how to present these findings effectively.
Takeaways
- 😀 One-way ANOVA is used to compare the means of three or more groups.
- 😀 It involves one independent grouping variable with three or more levels and one dependent continuous variable.
- 😀 Examples of its use include comparing income across cities, optimism levels across age groups, and staff satisfaction across job types.
- 😀 One-way ANOVA checks for differences in variance between groups caused by the independent variable.
- 😀 In SPSS, the process involves going to Analyze > Compare Means > One-way ANOVA.
- 😀 The test for homogeneity of variance (Levene's Test) should be checked before performing post-hoc analysis.
- 😀 The ANOVA table provides the F value and significance to determine if there are overall differences between groups.
- 😀 Post-hoc tests like Dunnett's T3 are used when variances are not equal to determine specific group differences.
- 😀 Results should be reported by summarizing the problem, hypothesis, ANOVA results, and post-hoc analysis in a structured format.
- 😀 Mean values, standard deviations, and significance levels should be included in the report to detail the differences between groups.
Q & A
What is One-Way ANOVA used for?
-One-Way ANOVA is used to compare the means of three or more independent groups to determine if there are any significant differences between them.
Why is it called 'One-Way' ANOVA?
-It is called 'One-Way' because it involves one independent variable with three or more levels and one dependent continuous variable.
What are the assumptions of One-Way ANOVA?
-The assumptions of One-Way ANOVA include the homogeneity of variances across groups, normal distribution of the dependent variable within each group, and independence of observations.
How is the homogeneity of variances assumption checked in SPSS?
-In SPSS, the homogeneity of variances assumption is checked using Levene's test, which is accessed through the 'Options' menu when running One-Way ANOVA.
What does it mean if the homogeneity of variances test is significant?
-If the homogeneity of variances test is significant, it suggests that the variances across the groups are not equal, indicating a violation of one of the ANOVA assumptions.
What is the purpose of post-hoc tests in ANOVA?
-Post-hoc tests are used to determine which specific groups differ from each other after a significant ANOVA result, providing more detailed information about the differences between group means.
What is Dunnett's T3 test used for in post-hoc analysis?
-Dunnett's T3 test is used for multiple comparisons when the assumption of equal variances is not met, allowing for the comparison of each group with a control group or between all pairs of groups.
How are the results of One-Way ANOVA reported in a research paper?
-The results of One-Way ANOVA are reported by stating the F-value, degrees of freedom, significance level, and the mean scores and standard deviations for each group, along with any post-hoc test results.
What does it mean if there is no significant difference between junior and middle level employees in terms of organizational commitment?
-If there is no significant difference between junior and middle level employees regarding organizational commitment, it suggests that the level of commitment is similar across these two levels within the organization.
How can the results of One-Way ANOVA be visualized in a research report?
-The results of One-Way ANOVA can be visualized using bar charts or box plots to show the mean scores and variability within each group, making it easier to compare the groups visually.
What is the role of the dependent variable in One-Way ANOVA?
-The dependent variable in One-Way ANOVA is the outcome or the variable of interest that is measured across different groups, such as organizational commitment, income, or optimism scores.
Can One-Way ANOVA be used with non-continuous data?
-One-Way ANOVA is typically used with continuous data. If the data is non-continuous or ordinal, a non-parametric alternative such as the Kruskal-Wallis test might be more appropriate.
What is the null hypothesis in One-Way ANOVA?
-The null hypothesis in One-Way ANOVA states that there are no significant differences between the group means, suggesting that the independent variable does not have an effect on the dependent variable.
How does the sample size affect the results of One-Way ANOVA?
-A larger sample size can increase the statistical power of the test, making it more likely to detect a significant effect if one exists. However, with very large sample sizes, even small differences can be statistically significant, which may not be practically significant.
Outlines
📊 Introduction to One-Way ANOVA in SPSS
This paragraph introduces the concept of One-Way ANOVA using SPSS, a statistical method for comparing the means of three or more groups. It explains the difference between One-Way ANOVA and other tests like the independent samples T-test, and provides examples of its application in various scenarios, such as comparing income across cities or optimism levels across age groups. The paragraph also sets up a specific example of investigating organizational commitment levels across different management levels within an organization.
🔍 Conducting One-Way ANOVA and Post Hoc Analysis
This section details the process of conducting a One-Way ANOVA in SPSS, starting with setting up the dependent and independent variables and checking for the assumption of homogeneity of variance. It discusses the significance of the Levene's test and the implications of its outcome on the choice of post hoc analysis. The paragraph also explains how to interpret the ANOVA results, including the F-value, significance level, and the use of descriptive statistics to compare group means. It concludes with the decision to use Dunnett's T3 for multiple comparisons when variances are not equal.
📝 Reporting One-Way ANOVA Results
The final paragraph focuses on how to report the results of a One-Way ANOVA in a written document. It provides a step-by-step guide on presenting the hypothesis, explaining the significance of the ANOVA table, and detailing the mean scores and standard deviations for each group. The paragraph emphasizes the importance of including the Levene's statistic, the choice of post hoc test, and the results of multiple comparisons. It concludes with an example of how to format the results in a table and integrate them into the text, ensuring clarity and precision in reporting statistical findings.
Mindmap
Keywords
💡Oneway ANOVA
💡Independent Samples T-Test
💡Dependent Variable
💡Independent Variable
💡Homogeneity of Variance
💡Post Hoc Analysis
💡Descriptives
💡Significance Level
💡Null Hypothesis
💡Multiple Comparisons
💡Levene's Test
💡Dunnett's T3
Highlights
Introduction to oneway ANOVA using SPSS, explaining its purpose and application.
Explanation of the difference between one sample test, independent sample T Test, and oneway ANOVA.
Definition of oneway ANOVA as a method to compare means across three or more groups.
Example of using oneway ANOVA to compare income of lecturers across three cities.
Illustration of comparing optimism levels across different age groups using ANOVA.
Application of oneway ANOVA in assessing staff satisfaction levels across different staff types.
Clarification of the assumptions behind oneway ANOVA, including homogeneity of variance.
Demonstration of how to conduct oneway ANOVA in SPSS, including selecting the dependent and independent variables.
Importance of checking homogeneity of variance before post-hoc analysis in SPSS.
Interpretation of oneway ANOVA results, including significance and F values.
Use of descriptive statistics to compare mean levels of commitment across different management levels.
Explanation of post-hoc analysis and selection of Dunnett's T3 for multiple comparisons.
Identification of significant differences in organizational commitment between junior and senior levels.
Discussion on the lack of significant difference between junior and middle level employees.
Reporting of oneway ANOVA results in a Word document, including hypothesis, methodology, and findings.
Guidance on how to present ANOVA results in a table format with mean values, standard deviations, and significance.
Final summary of the tutorial's goal to help understand oneway ANOVA and its reporting.
Transcripts
Browse More Related Video

Understanding Analysis of Variance (ANOVA) including Excel - Statistics Help

SPSS (9): Mean Comparison Tests | T-tests, ANOVA & Post-Hoc tests
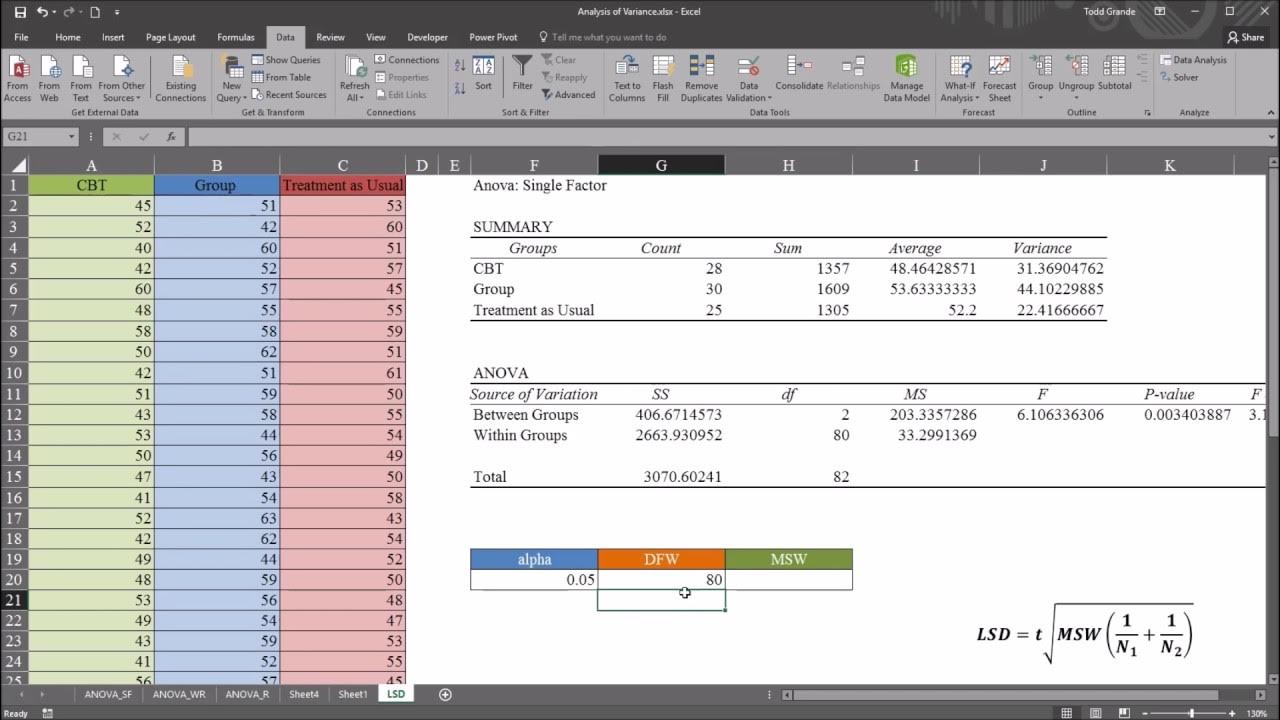
One-Way ANOVA with LSD (Least Significant Difference) Post Hoc Test in Excel

Mixed Design ANOVA

ANOVA (Analysis of variance) simply explained
Two factor ANOVA with repeated measures
5.0 / 5 (0 votes)
Thanks for rating: