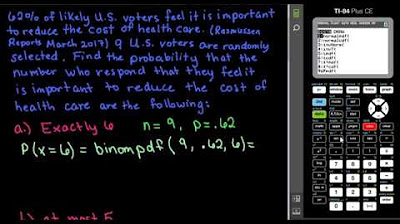
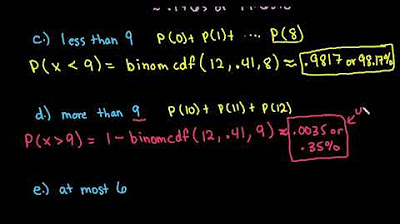
Finding Probabilities For A Binomial Distribution In StatCru
TLDRThe video tutorial guides students on finding probabilities for a binomial distribution using StatCrunch. It walks through a homework problem where 13% of adults regret getting tattoos because they were too young. The instructor demonstrates how to use StatCrunch to calculate probabilities, explaining each step. The tutorial covers finding probabilities for none, exactly one, and at most one adult regretting their tattoo decision. It also discusses the significance of low probability events. The example problem is thoroughly explained, aiding students in understanding binomial distribution calculations.
Takeaways
- 📚 The script is a tutorial on how to use StatCrunch to calculate probabilities for a binomial distribution.
- 📈 The example problem is based on a poll about adults who regret getting tattoos, specifically those who feel they were too young when they got inked.
- 🔢 The binomial distribution is identified as the appropriate statistical model due to the two possible outcomes (too young or not) for each selection.
- 🎯 The probability of success (an adult saying they were too young) is given as 13%, which is constant for each trial.
- 👤 The sample size is nine adults, randomly selected from the population.
- 🔧 StatCrunch is used to calculate the probabilities for different scenarios outlined in the homework problem.
- 📉 The first part of the problem asks for the probability that none of the selected adults were too young to get tattoos, which is calculated as 0.2855.
- 📌 For part B, the probability that exactly one adult was too young is calculated using the binomial calculator.
- 📝 In part C, the probability that zero or one adult was too young is found by summing the probabilities of these two outcomes or using the 'less than or equal to one' option in the calculator.
- 🤔 The final part of the problem questions whether one is a significantly low number of adults who were too young, with the answer indicating it is not, as the probability is over 5%.
- 🧮 The importance of rounding to four decimal places is emphasized for accuracy in reporting the calculated probabilities.
Q & A
What is the main topic of the video script?
-The main topic of the video script is to demonstrate how to calculate probabilities for a binomial distribution using StatCrunch software.
What is the context of the binomial distribution problem presented in the script?
-The context is a poll among adults who regret getting tattoos, where 13% say they were too young when they got their tattoos. The problem involves calculating probabilities based on a random selection of nine such adults.
What are the criteria that need to be met for a problem to be considered a binomial distribution?
-The criteria for a binomial distribution include a fixed number of trials, only two possible outcomes for each trial (success or failure), the same probability of success for each trial, and the trials being independent of each other.
How does the script define 'success' in the context of the binomial distribution problem?
-In the context of the problem, 'success' is defined as an adult saying they were too young when they got their tattoo, which has a 13% probability.
What tool within StatCrunch is used to calculate probabilities for a binomial distribution?
-The tool used within StatCrunch to calculate probabilities for a binomial distribution is the 'Binomial' calculator found under 'Stat Calculators'.
What is the default setting in the Binomial calculator of StatCrunch, and how does it relate to the example given?
-The default setting in the Binomial calculator is 10 trials with a success probability of 50%, which is analogous to flipping a coin 10 times and counting the number of heads.
How does the script instruct to adjust the default values in the Binomial calculator to fit the problem?
-The script instructs to change the default success probability from 50% to 13% to represent the 13% likelihood of an adult regretting being too young for a tattoo. It also instructs to change the number of trials from 10 to 9, as the problem involves selecting nine adults.
What is the probability calculated in part A of the problem, and what does it represent?
-In part A, the probability calculated is that none of the selected adults (x=0) say they were too young to get tattoos, which is approximately 28.55% or 0.2855 when converted to a decimal.
What is the probability calculated in part B of the problem, and what does it represent?
-In part B, the probability calculated is that exactly one of the selected adults says they were too young to get tattoos (x=1), which is provided as a decimal rounded to four decimal places.
How is the probability for part C of the problem calculated, and what does it represent?
-In part C, the probability is calculated for the number of adults who say they were too young being zero or one (x ≤ 1). This is done by either adding the probabilities of x=0 and x=1 or by using the calculator to find the cumulative probability for x ≤ 1.
What is the conclusion in the last part of the problem regarding the significance of the number of adults who say they were too young?
-The conclusion is that the probability of getting at most one adult saying they were too young is not significantly low (greater than 5%), indicating that one is not a significantly low number in this context.
Outlines
📚 Introduction to Binomial Distribution in StatCrunch
This paragraph introduces a video tutorial aimed at teaching students how to calculate probabilities for a binomial distribution using StatCrunch. The context is a homework problem from a textbook, where the scenario involves a poll about adults who regret getting tattoos and the specific focus is on the age at which they got inked. The video demonstrates how to recognize a binomial distribution situation and the importance of understanding the criteria for its application. It guides viewers on how to set up the problem in StatCrunch, highlighting the need to adjust the default values to fit the specific situation, which in this case involves a success rate of 13% and a sample size of nine adults.
🔢 Calculating Specific Probabilities with the Binomial Calculator
The second paragraph delves into the process of using the binomial calculator in StatCrunch to find specific probabilities related to the given scenario. It explains how to input the correct values for the probability of success (13%) and the number of trials (nine adults). The tutorial then walks through calculating the probability that none of the selected adults felt they were too young when they got their tattoos, which is the first part of the homework problem. The video also covers how to compute the probability of exactly one adult feeling they were too young, and the cumulative probability of zero or one adult expressing this sentiment. Finally, it addresses the question of whether one adult feeling too young is a significantly low number, concluding that it is not based on the calculated probabilities.
Mindmap
Keywords
💡Binomial Distribution
💡StatCrunch
💡Probability
💡Trials
💡Success
💡Failure
💡Calculator
💡Probability of Success
💡Significantly Low
💡Random Selection
Highlights
Introduction to finding probabilities for a binomial distribution using StatCrunch.
The example problem involves adults who regret getting tattoos, focusing on those who felt they were too young.
Key criteria for recognizing a binomial distribution: dual outcomes and constant probability of success.
Using StatCrunch to calculate binomial probabilities: navigate to stat calculators binomial.
Set up the calculator with 13% probability of success and 9 trials.
Calculating the probability that none of the selected adults say they were too young.
The result for zero successes: 0.2855.
Finding the probability that exactly one adult says they were too young.
The result for one success: 0.4284.
Calculating the probability that zero or one adult says they were too young by summing individual probabilities.
Using the less than or equal to function in StatCrunch for combined probabilities.
The result for zero or one success: 0.6695, rounded to 0.6696.
Determining if one or fewer successes is a significantly low number.
Significant low probability is typically considered below 5%.
Conclusion: One or fewer successes is not significantly low because the probability is over 60%.
Transcripts
Browse More Related Video
5.0 / 5 (0 votes)
Thanks for rating:


