Binomial Probability with TI-84
TLDRThis video tutorial demonstrates how to calculate binomial probabilities using a TI-84 calculator, focusing on a Gallup poll scenario. It explains the binomial setup, including fixed trials and constant probability of success, and covers various probability scenarios: exactly, at least, less than, more than, at most, and between values inclusively and exclusively. The presenter guides viewers through the calculator functions for binom PDF and CDF, providing step-by-step instructions and emphasizing the importance of interpreting results correctly.
Takeaways
- 📊 The video demonstrates how to calculate binomial probabilities using a TI-84 calculator for a Gallup poll question regarding Americans' concerns about Social Security.
- 🇺🇸 In the poll, 41% of Americans expressed significant worry about the Social Security system, and the video focuses on this percentage as the probability of 'success' in binomial calculations.
- 🔢 The binomial probability formula is applied to a fixed number of trials (n=12), with each trial being independent and having the same probability of success (p=0.41).
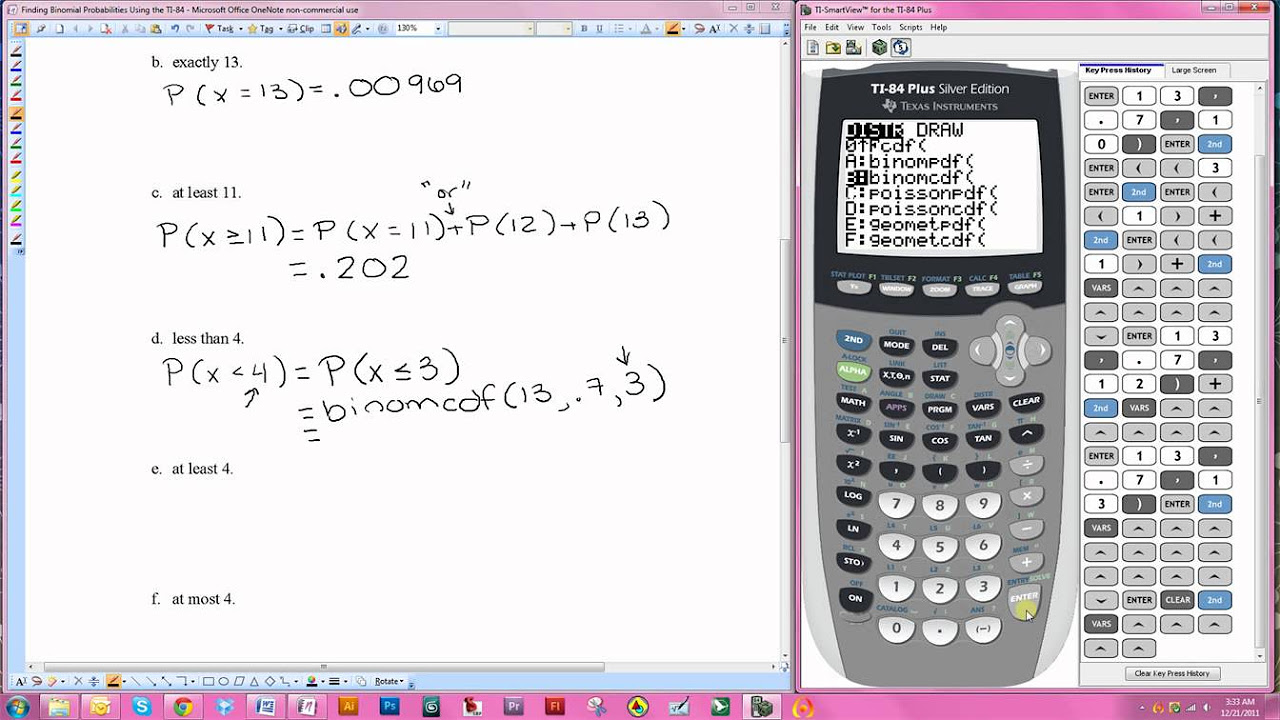
- 🔍 The video covers various scenarios including 'exactly', 'at least', 'less than', 'more than', 'at most', and 'between', both inclusive and exclusive.
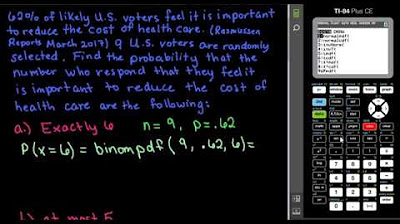
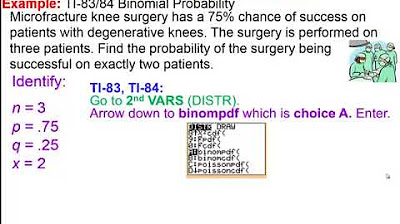
- 📝 For 'exactly' scenarios, the binomial PDF (Probability Density Function) is used, which requires input in the format n, p, x.
- 📈 For 'at least', 'less than', 'more than', 'at most', and 'between' scenarios, the binomial CDF (Cumulative Distribution Function) is more efficient, as it sums probabilities from zero up to a specified value.
- 📱 The TI-84 calculator is navigated through the VARS key for accessing distributions, with specific shortcuts for binom PDF (A) and binom CDF (B).
- 📉 To find 'at least' a certain number, one must subtract the CDF result up to one less than the desired number from 1, due to the calculator's inclusive nature up to the specified x value.
- 🔧 The video provides an example of calculating the probability of exactly five people being worried (approximately 23%) and explains how to interpret this result.
- 🤔 The script emphasizes the importance of understanding whether a scenario is inclusive or exclusive, as this affects the calculation method and final probabilities.
- 👍 The presenter encourages viewers to watch the entire video or skip to specific sections based on their needs and invites questions or requests for additional topics.
Q & A
What is the main topic of the video?
-The main topic of the video is to demonstrate how to calculate binomial probability using a TI-84 calculator, with a specific example based on a Gallup poll about Americans' concerns regarding the Social Security system.
Why is the problem considered binomial?
-The problem is considered binomial because it meets the criteria for a binomial distribution: a fixed number of trials (12 Americans selected), a constant probability of success for each trial (41% worry about Social Security), and the independence of each trial (each person's response is independent of the others).
What does 'success' represent in this context?
-'Success' in this context represents an American responding that they worry a great deal about the Social Security system.
What calculator function is used to find the probability of exactly a certain number of successes?
-The calculator function used to find the probability of exactly a certain number of successes is binom PDF (Probability Distribution Function).
How is the binom PDF function accessed on a TI-84 calculator?
-The binom PDF function is accessed by pressing '2nd' followed by the 'VARS' key, then selecting 'A' for binom PDF from the distributions menu.
What is the format for inputting values into the binom PDF function?
-The format for inputting values into the binom PDF function is n, p, x, where n is the number of trials, p is the probability of success, and x is the number of successes.
What is the probability of exactly five Americans out of twelve worrying a great deal about Social Security, according to the video?
-The probability of exactly five Americans out of twelve worrying a great deal about Social Security is approximately 23%.
What does 'at least' in a probability context imply, and how is it calculated?
-'At least' in a probability context implies a value greater than or equal to a certain number. It is calculated using the binom CDF (Cumulative Distribution Function) by subtracting the probability of all outcomes less than the specified value.
How is the 'at most' scenario different from the 'at least' scenario in terms of calculation?
-The 'at most' scenario is different from the 'at least' scenario because it includes the specified value as the maximum. It is calculated using the binom CDF by including the specified value in the cumulative sum and not subtracting any probabilities.
What is the probability of less than nine people out of twelve worrying a great deal about Social Security?
-The probability of less than nine people out of twelve worrying a great deal about Social Security is approximately 98.17%.
How does the video demonstrate calculating the probability of more than nine people worrying about Social Security?
-The video demonstrates calculating the probability of more than nine people worrying about Social Security by using the binom CDF function and excluding the probability of nine by setting the x value to nine and using one minus the result of the CDF calculation.
What is the probability of at most six people out of twelve worrying a great deal about Social Security?
-The probability of at most six people out of twelve worrying a great deal about Social Security is approximately 82.35%.
How are inclusive and exclusive ranges handled in binomial probability calculations?
-Inclusive ranges include the endpoints, so the binom CDF is used from zero up to and including the endpoint. Exclusive ranges exclude the endpoints, so the binom CDF is used from the lower endpoint up to but not including the upper endpoint, and adjustments are made to exclude the endpoints.
What is the probability of between three and eight people, inclusive, responding that they worry about Social Security?
-The probability of between three and eight people, inclusive, responding that they worry about Social Security is approximately 90.84%.
How can you quickly navigate through the calculator functions in the video?
-You can quickly navigate through the calculator functions by using the alpha key combined with the letter corresponding to the function (e.g., 'A' for binom PDF and 'B' for binom CDF), or by using the up arrow key to access the last entered function.
Outlines
📊 Binomial Probability Calculation with TI-84
This paragraph introduces a binomial probability question using a Gallup poll statistic from March 2019, where 41% of Americans expressed significant concern about the Social Security system. The video aims to calculate the probability of different outcomes when 12 Americans are selected, treating a positive response as 'success' and a negative one as 'failure'. The TI-84 calculator is used to demonstrate binomial probability calculations, including exact, at least, less than, more than, at most, and ranges of outcomes. The explanation covers how to use the binomial PDF (Probability Density Function) for exact values and the binomial CDF (Cumulative Distribution Function) for ranges, with specific examples and calculator instructions provided.
🔢 Calculating 'At Least' Probabilities Using Binomial CDF
The second paragraph delves into the concept of 'at least' probabilities in binomial distributions, illustrating how to calculate the likelihood of seven or more successes out of 12 trials using the binomial CDF on a TI-84 calculator. The process involves using the CDF to sum probabilities from zero up to six and then subtracting this from one to account for the 'at least' condition. The result indicates an approximately 18% chance of this event, highlighting the efficiency of using CDF over individual PDF calculations for ranges of outcomes.
📉 Understanding 'Less Than' and 'More Than' Probabilities
This section explains how to calculate probabilities for outcomes that are 'less than' or 'more than' a certain number of successes. For 'less than', the example given is calculating the probability of eight or fewer successes, using the binomial CDF to sum probabilities from zero to eight. Conversely, for 'more than', the example is the probability of 10 or more successes, which is calculated by subtracting the CDF up to nine from one, as the binomial CDF does not include the upper limit in its sum. The results show a very high likelihood of less than nine successes and a very low likelihood of 10 or more, emphasizing the rarity of extreme outcomes.
🏁 Calculating 'At Most' and 'Between' Probabilities
The final paragraph discusses calculating probabilities for 'at most' a certain number of successes and for a range of successes 'between' two numbers, both inclusive and exclusive. For 'at most' six successes, the CDF is used to sum probabilities from zero to six. For 'between' three and eight inclusive, the CDF is used to sum probabilities from three to eight and then subtract the sum from zero to two. For the exclusive range between four and seven, the CDF is adjusted to sum from four to seven and subtract the sum from zero to three. The video concludes with a recap of when to use PDF versus CDF and an invitation for further questions or topics.
Mindmap
Keywords
💡Binomial Probability
💡TI-84 Calculator
💡Success and Failure
💡Fixed Number of Trials
💡Probability of Success
💡Independence
💡Binomial PDF
💡Binomial CDF
💡Inclusive and Exclusive
💡Interpretation
💡Unusual Values
Highlights
Introduction to solving a binomial probability question using the TI-84 calculator.
Explanation of a Gallup poll statistic from March 2019 regarding Americans' concerns about Social Security.
Selection of 12 Americans to find the probability of various outcomes related to their concerns about Social Security.
Identification of the problem as binomial due to fixed number of trials and constant probability of success.
Description of 'success' and 'failure' in the context of the binomial problem.
Use of binomial Probability Distribution Function (PDF) for calculating exact probabilities.
Method to input values into the TI-84 calculator for binom PDF: n, p, x format.
Navigation of the TI-84 calculator to access binomial distribution functions.
Calculation of the probability that exactly five out of twelve people are concerned about Social Security, resulting in approximately 23%.
Explanation of calculating 'at least' probabilities using binomial Cumulative Distribution Function (CDF).
How to interpret the result of the 'at least' calculation, indicating an 18% chance of seven or more people being concerned.
Process for calculating 'less than' probabilities and the high likelihood of fewer than nine people being concerned, at 98.17%.
Method for calculating 'more than' probabilities, showing a very low chance of ten or more people being concerned.
Calculation of 'at most' probabilities using binom CDF, with an 82.35% chance of six or fewer people being concerned.
Approach to calculating probabilities for a range 'between' values, both inclusive and exclusive.
Final calculation showing a 90.84% probability of three to eight people being concerned, inclusive, and 72.91% exclusive.
Summary of when to use PDF versus CDF in binomial distribution calculations.
Transcripts
Browse More Related Video
Finding Binomial Probabilities Using the TI-84
Binomial Probability Using the TI-84

Using TI-84 to calculate binomial probability distribution
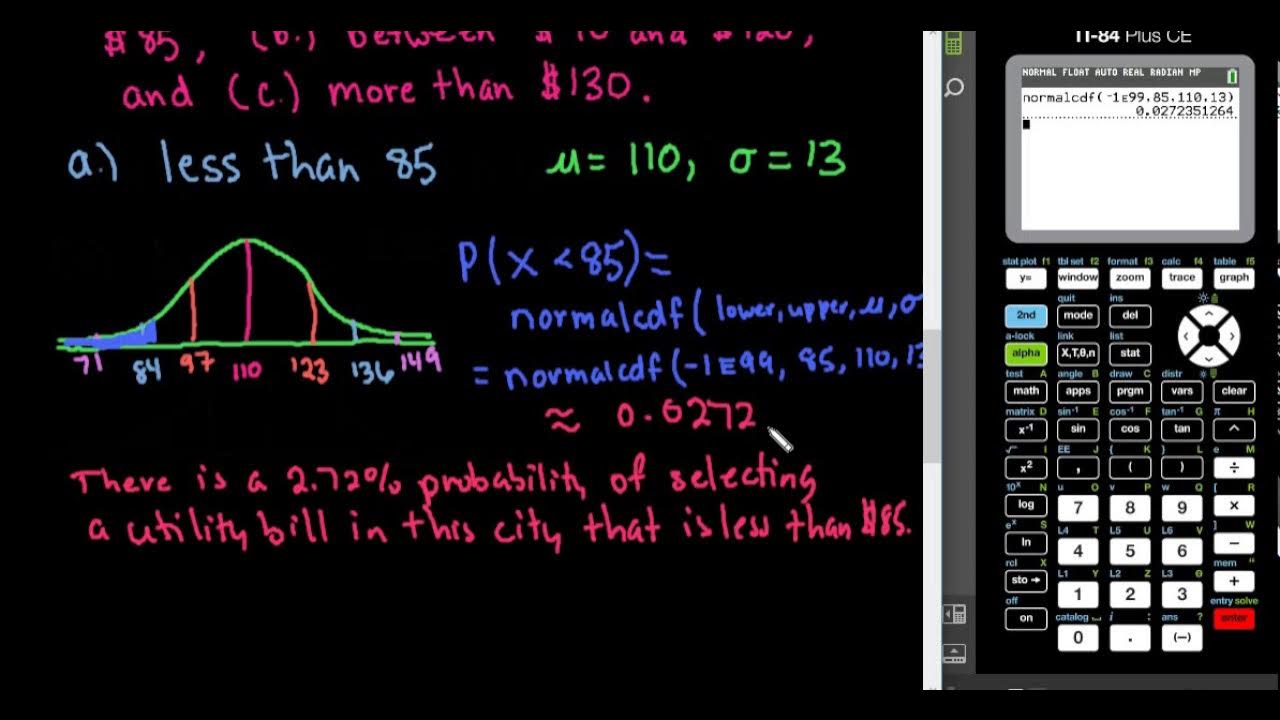
Probabilities in a Normal Distribution - TI-84
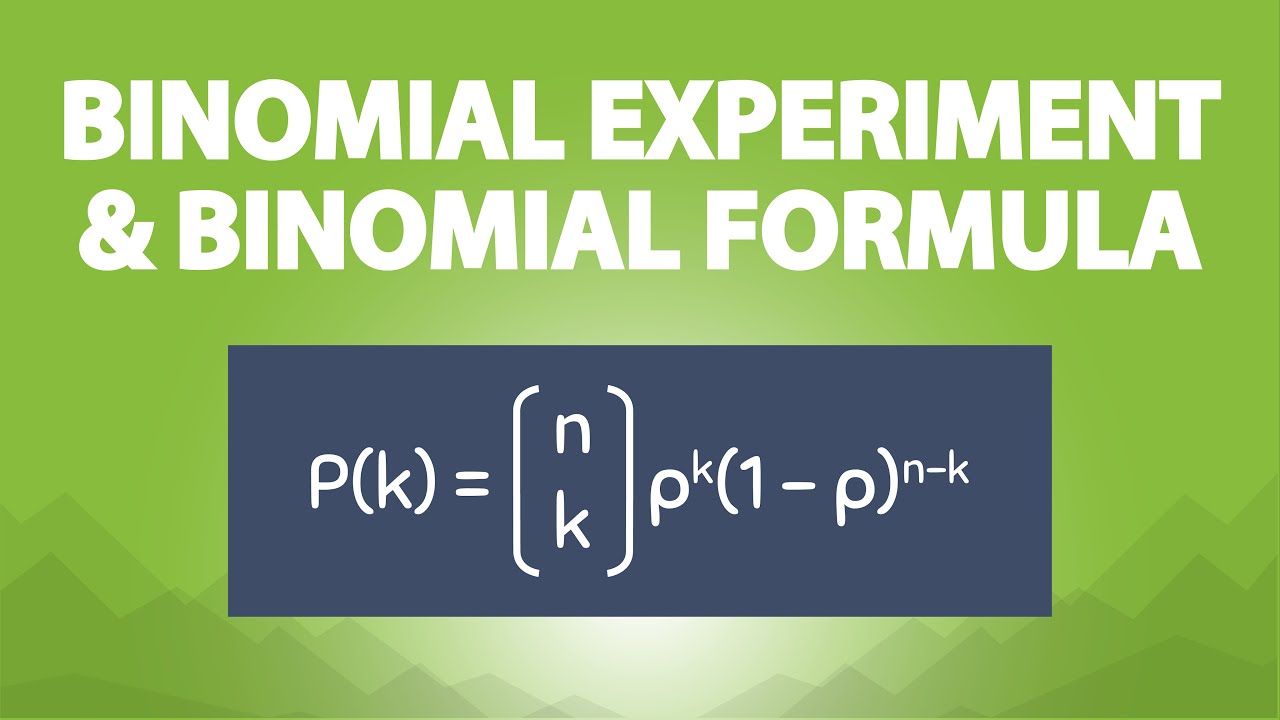
The Binomial Experiment and the Binomial Formula (6.5)
Elementary Statistics - Chapter 5 Binomial Distributions Part 2
5.0 / 5 (0 votes)
Thanks for rating: