Binomial Distribution in R | R Tutorial 3.1| MarinStatsLectures
TLDRIn this instructional video, Mike Marin teaches viewers how to calculate probabilities for a binomial random variable in R, using the 'dbinom' and 'pbinom' functions. He demonstrates finding the probability of exactly 3 successes in 20 trials with a success probability of 1/6, as well as cumulative probabilities up to 3 successes. The video also covers how to sum probabilities and use the 'rbinom' and 'qbinom' functions for sampling and finding quantiles, offering a comprehensive guide to binomial distribution in R.
Takeaways
- 📚 The video is an instructional guide on calculating probabilities for a binomial random variable using R programming language.
- 🔢 The binomial distribution discussed has a fixed number of trials, n=20, and a probability of success, p=1/6.
- 🛠️ The 'dbinom' function in R can be used to find the probability density function for a given value of X in a binomial distribution.
- 🎯 An example provided calculates the probability of exactly 3 successes in 20 trials, which is approximately 23.8%.
- 📈 The 'dbinom' function can also return multiple probabilities for different values of X, from 0 to 3 in the given example.
- 📊 The probability of exactly 0 successes is approximately 2.6%, and for exactly 1 success, it's about 10.4%.
- 🔄 To find the cumulative probability of 3 or fewer successes, one can sum the individual probabilities calculated earlier.
- 📉 Alternatively, the 'pbinom' function can be used to calculate the cumulative probability directly, with the example yielding a 56.6% chance of 3 or fewer successes.
- 🔧 The 'pbinom' function requires setting the 'lower.tail' parameter to TRUE to get the probability of X being less than or equal to a certain value.
- 🔮 Other functions like 'rbinom' and 'qbinom' are mentioned for sampling from and finding quantiles of a binomial distribution, respectively.
- 👨🏫 The presenter encourages viewers to watch another video on the normal distribution for further insights into probability calculations.
Q & A
What is the main topic of the video by Mike Marin?
-The main topic of the video is calculating probabilities for a binomial random variable using the R programming language.
What is the binomial distribution and how many trials are considered in this video?
-The binomial distribution is a discrete probability distribution of the number of successes in a fixed number of independent Bernoulli trials with the same probability of success. In the video, the number of trials considered is 20 (n=20).
What is the probability of success, p, in the binomial distribution discussed in the video?
-The probability of success, p, in the binomial distribution discussed in the video is 1/6.
Which R functions are mentioned in the video for calculating binomial probabilities?
-The R functions mentioned in the video for calculating binomial probabilities are 'pbinom', 'dbinom', 'rbinom', and 'qbinom'.
How can one find the probability of exactly 3 successes in 20 trials using the 'dbinom' function in R?
-To find the probability of exactly 3 successes in 20 trials using the 'dbinom' function, you would specify the number of successes (3), the number of trials (20), and the probability of success (1/6), and the function will return the probability.
What is the probability of exactly 3 successes in 20 trials according to the video?
-According to the video, the probability of exactly 3 successes in 20 trials is approximately 23.8%.
How can you calculate the cumulative probability of 3 or fewer successes using the 'dbinom' function?
-To calculate the cumulative probability of 3 or fewer successes, you can use the 'dbinom' function to calculate the probabilities for 0 to 3 successes and then sum these probabilities using the 'sum' command in R.
What is the cumulative probability of 3 or fewer successes according to the video?
-The cumulative probability of 3 or fewer successes, according to the video, is approximately 56.6%.
How can you find the probability of a binomial variable being less than or equal to a certain value using the 'pbinom' function?
-To find the probability of a binomial variable being less than or equal to a certain value using the 'pbinom' function, you specify the binomial value, the number of trials, the probability of success, and set the 'lower.tail' parameter to TRUE.
What is the purpose of the 'rbinom' and 'qbinom' functions in R when working with binomial distributions?
-The 'rbinom' function is used to take a random sample from a binomial distribution, while the 'qbinom' function is used to find quantiles for the binomial distribution.
What additional resource is suggested in the video for further understanding of probability distributions?
-The video suggests checking out another video by Mike Marin on the normal distribution for further insight on how to use probability distributions.
Outlines
📚 Introduction to Binomial Probability in R
In this introductory segment, Mike Marin explains the focus of the video on calculating probabilities for a binomial random variable using the R programming language. The scenario involves a binomial distribution with 20 trials (n=20) and a success probability of 1/6 (p=1/6). The 'pbinom' and 'dbinom' functions are highlighted as essential tools for these calculations. Additionally, viewers are guided on how to access the Help menu in R for further assistance with commands.
🔍 Calculating Exact Probabilities with 'dbinom'
This paragraph delves into using the 'dbinom' function to find the exact probability of a specific outcome, such as exactly 3 successes out of 20 trials. The function's syntax and parameters are explained, demonstrating how to input the number of successes, sample size, and probability of success to get the probability of 23.8% for exactly 3 successes. The paragraph also covers how to retrieve probabilities for multiple outcomes, such as from 0 to 3 successes, using the same function.
📊 Summing Probabilities for Ranges of Outcomes
The third paragraph explains how to calculate the cumulative probability for a range of outcomes, such as the probability of 3 or fewer successes. It details two methods: manually summing the individual probabilities obtained from 'dbinom' using the 'sum' command, and directly using the 'pbinom' function, which provides the cumulative probability. The 'pbinom' function is described with its parameters, including the lower tail argument set to TRUE to indicate the probability of less than or equal to a certain number of successes.
🚀 Additional Binomial Distribution Commands
The final paragraph introduces other R commands related to the binomial distribution, such as 'rbinom' for generating random samples and 'qbinom' for finding quantiles. It also encourages viewers to watch another video by the same presenter on the normal distribution for related insights. The video concludes with a thank you and an invitation to explore more instructional content.
Mindmap
Keywords
💡Binomial Random Variable
💡Binomial Distribution
💡R Programming Language
💡pbinom Function
💡dbinom Function
💡Probability Density Function (PDF)
💡Probability Mass Function (PMF)
💡Cumulative Distribution Function (CDF)
💡rbinom Function
💡qbinom Function
💡Normal Distribution
Highlights
Introduction to calculating probabilities for a binomial random variable using R.
Focus on a binomial distribution with n=20 trials and a success probability p=1/6.
Use 'pbinom' or 'dbinom' functions in R to calculate binomial probabilities.
Accessing the Help menu in R for function usage.
Using 'dbinom' to find the probability density function value for X=3.
Calculating the probability of exactly 3 successes in 20 trials is approximately 23.8%.
Obtaining multiple probabilities for X from 0 to 3 using 'dbinom'.
Finding the probability of exactly 0 successes is approximately 2.6%.
Calculating the chance of exactly 1 success is approximately 10.4%.
Summing probabilities to find the chance of 3 or fewer successes.
Using 'sum' command in R to calculate the total probability of 3 or fewer successes, which is approximately 56.6%.
Alternative method to calculate the probability of 3 or fewer successes using 'pbinom'.
Setting 'lower.tail=TRUE' in 'pbinom' to find the cumulative probability.
Introduction to 'rbinom' for random sampling from a binomial distribution.
Using 'qbinom' to find quantiles for the binomial distribution.
Reference to a video on the normal distribution for further insights.
Closing remarks and invitation to watch other instructional videos.
Transcripts
Browse More Related Video
Poisson Distribution in R | R Tutorial 3.2 | MarinStatsLectures
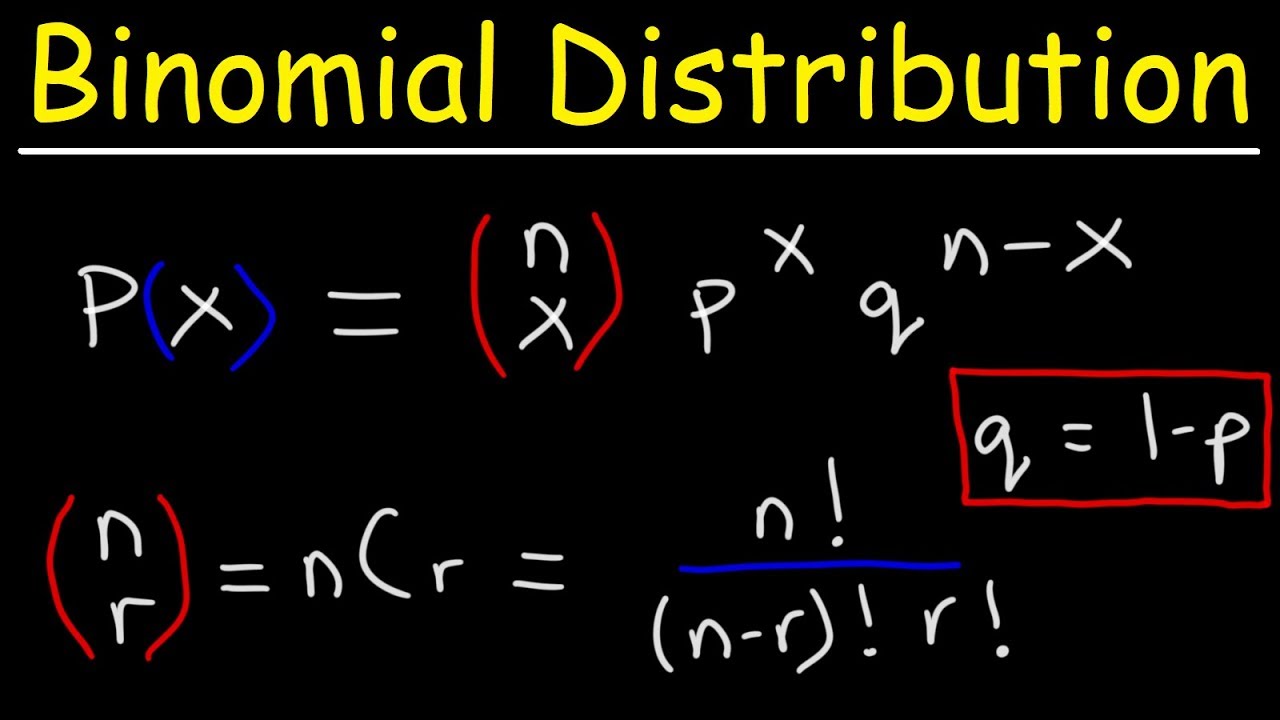
Finding The Probability of a Binomial Distribution Plus Mean & Standard Deviation
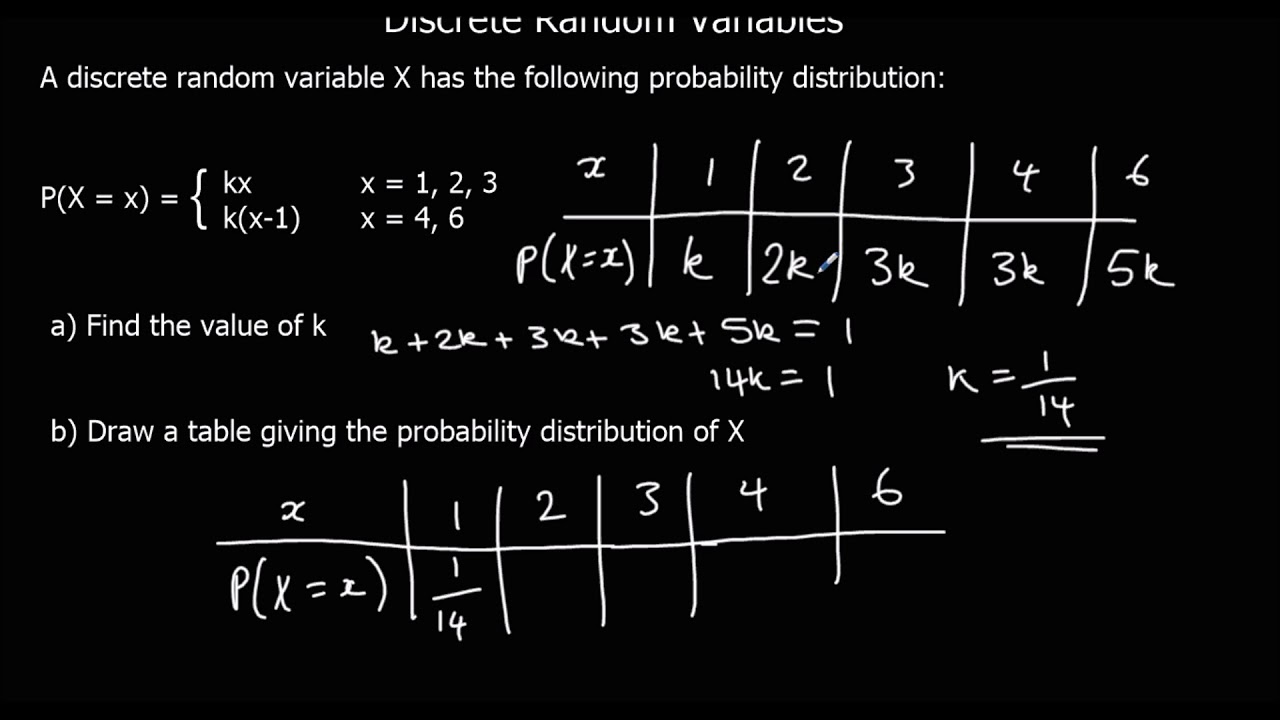
Discrete Random Variables

Normal Distribution, Z Scores, and Normal Probabilities in R | R Tutorial 3.3| MarinStatslectures
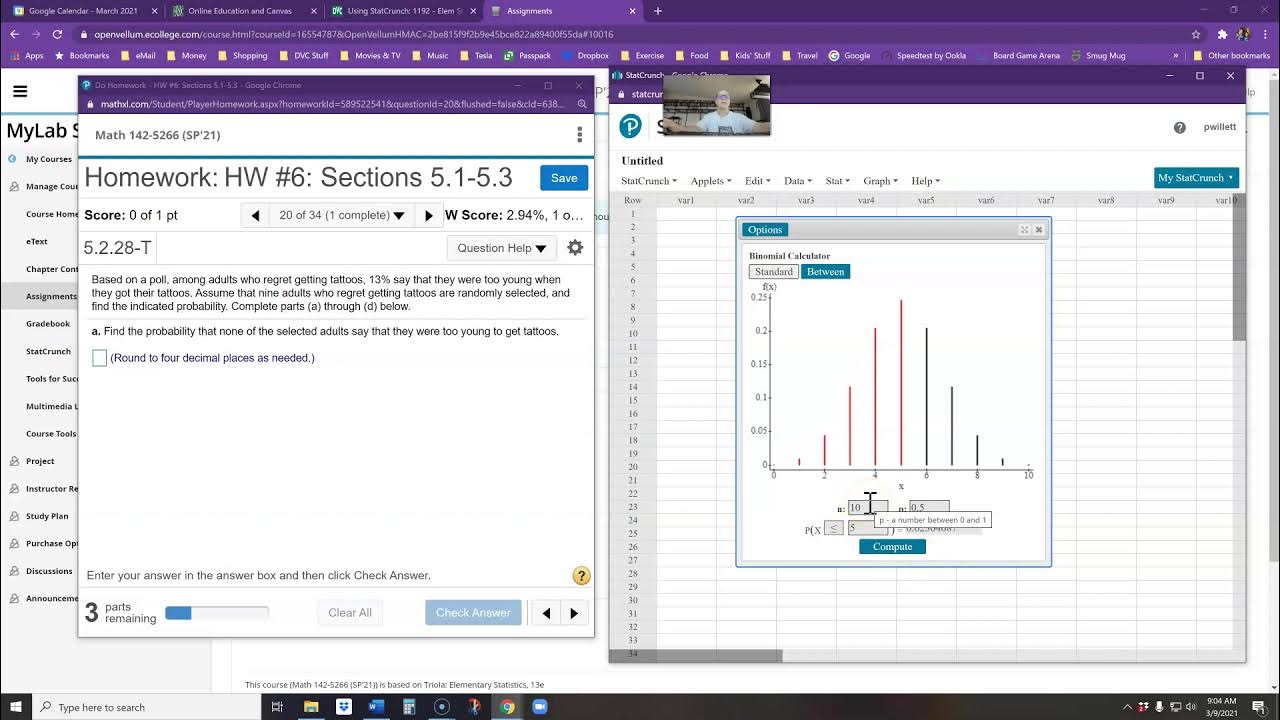
Finding Probabilities For A Binomial Distribution In StatCru
5.2.1 Binomial Probability Distributions - Is this procedure described by a binomial distribution?
5.0 / 5 (0 votes)
Thanks for rating: