Binomial Probability Using the TI-84
TLDRThis instructional video demonstrates how to calculate binomial probabilities using the TI-84 graphing calculator. It covers a specific example involving voter opinions on healthcare costs, explaining the concept of binomial distribution with two outcomes. The video guides viewers through the process of finding probabilities for different scenarios, such as exactly six voters agreeing, at most five, more than four, less than seven, and at least four voters, using shortcuts and functions like binome PDF and binomcdf. The presenter emphasizes the importance of translating these probabilities into real-world context for better understanding.
Takeaways
- 📚 The video demonstrates how to calculate binomial probabilities using a TI-84 graphing calculator.
- ⏱ The presenter opts for a shortcut method on the calculator rather than the formula for time efficiency.
- 📊 The example scenario involves finding the probability that a certain number of randomly selected U.S. voters believe it is important to reduce healthcare costs.
- 🔢 Key inputs for the calculator include the number of trials (n=9), the probability of success (p=0.62), and the number of successes (x).
- 🎯 The binomial PDF (probability density function) is used for exact outcomes, while the binomial CDF (cumulative distribution function) is for ranges of outcomes.
- 🔍 The 'binome PDF' function on the calculator is used for finding the probability of exactly x successes.
- 📈 The 'binomcdf' function is used for cumulative probabilities, such as 'at most' or 'at least' a certain number of successes.
- 📝 The script emphasizes the importance of translating probabilities into real-world scenarios and expressing them in sentence form for clarity.
- 🔄 The video covers various scenarios including 'exactly,' 'at most,' 'more than,' 'less than,' and 'at least' a certain number of successes.
- 🔢 The presenter explains how to use the calculator to find probabilities for each scenario, including using the complement rule for 'more than' and 'less than'.
- 🔄 The script mentions a future video that will cover the binomial formula for those who need to understand the mathematical process behind the calculator's shortcut.
Q & A
What is the main topic of the video?
-The main topic of the video is demonstrating how to calculate binomial probabilities using the TI-84 graphing calculator.
What is the context of the example problem presented in the video?
-The example problem is based on a statistic that 62% of likely U.S. voters feel it is important to reduce the cost of health care, as reported by Russ Rasmussen Reports in March 2017.
How many people are randomly selected in the example problem?
-In the example problem, 9 U.S. voters are randomly selected.
What is the definition of 'success' in the context of the binomial problem presented?
-In the context of the binomial problem, 'success' is defined as a respondent feeling that it is important to reduce the cost of health care.
What is the probability of success (p) used in the example calculations?
-The probability of success (p) used in the example calculations is 0.62.
What is the TI-84 calculator shortcut for calculating binomial probabilities?
-The TI-84 calculator shortcut for calculating binomial probabilities is using the binompdf and binomcdf functions under the 'Distributions' menu.
What does 'binompdf' stand for and when is it used?
-'Binompdf' stands for binomial probability density function, and it is used when calculating the probability of a single specific outcome in a binomial distribution.
What does 'binomcdf' stand for and when is it used?
-'Binomcdf' stands for binomial cumulative distribution function, and it is used when calculating the cumulative probability up to a certain outcome in a binomial distribution.
How does the video demonstrate finding the probability of exactly six voters feeling that reducing health care costs is important?
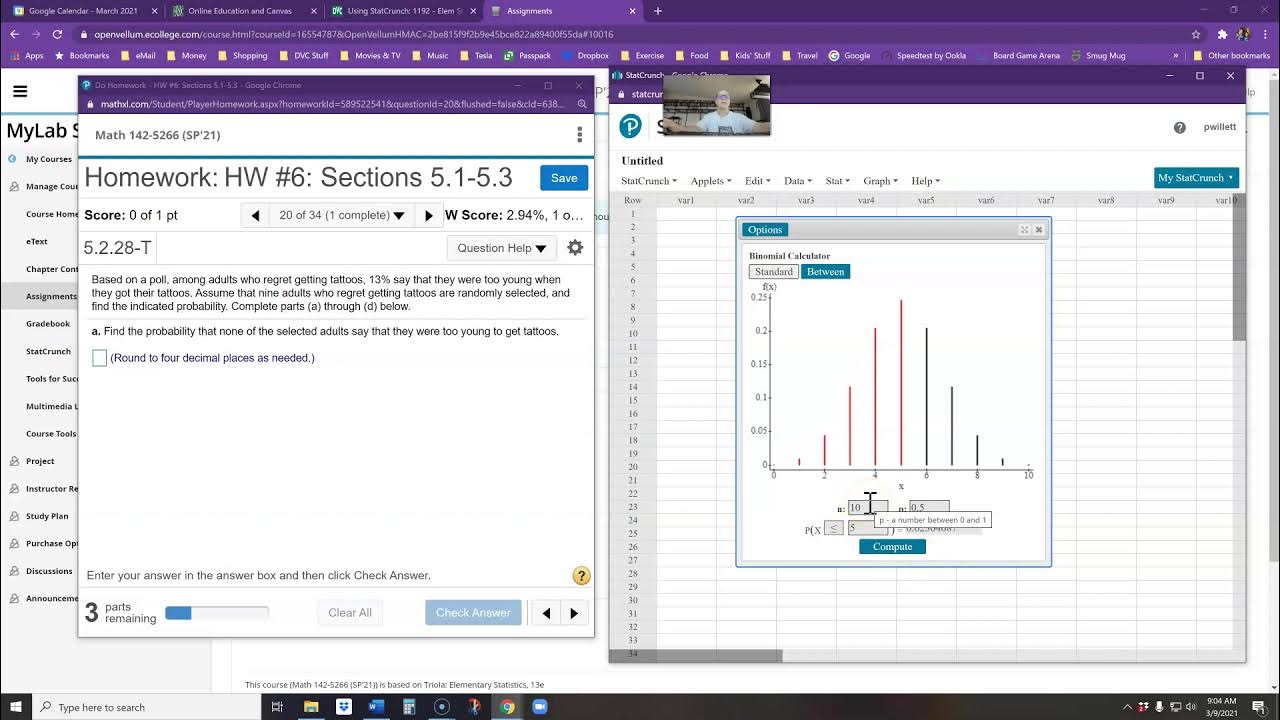
-The video demonstrates this by inputting the values n=9, p=0.62, and x=6 into the binompdf function on the TI-84 calculator.
What is the approximate probability of exactly six voters responding as described, according to the video?
-The approximate probability of exactly six voters responding as described is 0.261 or 26.1%.
How does the video handle the calculation for 'at most 5' voters responding as described?
-The video uses the binomcdf function on the TI-84 calculator, summing the probabilities from x=0 to x=5, to find the 'at most 5' scenario.
What is the approximate probability of at most 5 voters responding as described?
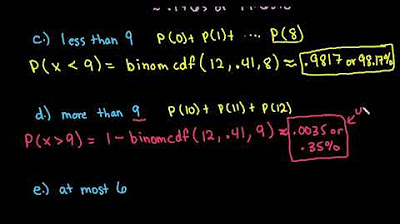
-The approximate probability of at most 5 voters responding as described is 0.4669 or 46.69%.
How does the video explain finding the probability of 'more than 4' voters responding as described?
-The video explains that for 'more than 4', one can use the complement rule by calculating the binomcdf from x=0 to x=4 and then subtracting this value from 1 on the TI-84 calculator.
What is the approximate probability of more than 4 voters responding as described?
-The approximate probability of more than 4 voters responding as described is 0.7738 or 77.38%.
How does the video calculate the probability of 'less than 7' voters responding as described?
-The video calculates this by using the binomcdf function on the TI-84 calculator, summing the probabilities from x=0 to x=6.
What is the approximate probability of less than 7 voters responding as described?
-The approximate probability of less than 7 voters responding as described is 0.7287 or 72.87%.
How does the video calculate the probability of 'at least 4' voters responding as described?
-The video calculates this by using the binomcdf function on the TI-84 calculator, summing the probabilities from x=4 to x=9.
What is the approximate probability of at least 4 voters responding as described?
-The approximate probability of at least 4 voters responding as described is 0.9213 or 92.13%.
Will the video provide an explanation of the binomial formula in a separate video?
-Yes, the video mentions that a separate video will be made to explain the binomial formula for those who need to understand the underlying calculations.
Outlines
📚 Introduction to Binomial Probability on TI-84
This paragraph introduces the video's purpose, which is to demonstrate how to calculate binomial probabilities using the TI-84 graphing calculator. The example provided involves determining the probability that exactly six out of nine randomly selected US voters feel it is important to reduce healthcare costs, based on a report from March 2017. The explanation includes the definition of binomial probability, emphasizing the two outcomes (success or failure), a fixed number of trials, and a constant probability of success. The TI-84's shortcut method is highlighted for efficiency, and the necessary parameters for the calculation (number of trials 'n', probability of success 'p', and number of successes 'x') are identified.
🔢 Calculating 'At Most' and 'More Than' Probabilities
The second paragraph delves into calculating probabilities for scenarios where the number of voters is 'at most' a certain number and 'more than' another. It explains the process of using the binomial probability density function (PDF) for exact outcomes and the cumulative distribution function (CDF) for ranges of outcomes. The paragraph illustrates how to find the probability of at most five voters feeling the importance of reducing healthcare costs by summing individual binomial PDFs or using the binomCDF function. It also covers the use of the complement rule to find the probability of more than four voters holding this view by subtracting the binomCDF of four from one.
📉 Understanding 'Less Than' and 'At Least' Probabilities
The final paragraph focuses on calculating probabilities for outcomes that are 'less than' a specific number and 'at least' another. It describes the process of using the binomCDF to find the sum of probabilities for outcomes less than seven and adjusting the function to exclude certain values for the 'at least' scenario. The paragraph provides a step-by-step guide on how to input values into the calculator and interpret the results, emphasizing the importance of understanding the calculator's starting point and the use of the complement rule. The video concludes with a promise to cover the formula in a future video and a thank you for watching.
Mindmap
Keywords
💡Binomial Probability
💡TI-84 Graphing Calculator
💡Russ Rasmussen Reports
💡Success and Failure
💡Fixed Number of Trials
💡Probability of Success
💡Binome PDF
💡Cumulative Distribution Function (CDF)
💡Complement Rule
💡Shortcut
💡Real-World Setting
Highlights
The video demonstrates how to find binomial probabilities using a TI-84 graphing calculator.
A shortcut method for calculating binomial probabilities on the TI-84 is showcased, as opposed to using the formula.
The example problem involves finding the probability of U.S. voters who feel it is important to reduce healthcare costs.
The problem is based on a 2017 report from Russ Rasmussen Reports, with 62% of voters in favor of reducing healthcare costs.
The binomial probability is calculated for exactly six out of nine voters feeling that healthcare costs should be reduced.
The TI-84 calculator's binomial PDF function is used to find the probability of a single outcome.
Instructions are provided on how to input the values into the calculator for the binomial PDF.
The result of the calculation is approximately 26.125%, representing the probability of exactly six voters.
The importance of writing probabilities in a real-world context is emphasized.
The video then explores the probability of at most five voters feeling that healthcare costs should be reduced.
The binomial cumulative distribution function (CDF) is introduced for calculating probabilities of 'at most' a certain number.
The probability of at most five voters is calculated to be approximately 46.669%.
The concept of 'more than' a certain number is explained, and the TI-84 calculator's complement rule is used.
The probability of more than four voters is found to be approximately 77.375%.
The video explains how to calculate the probability of less than a certain number using the binomcdf function.
The probability of less than seven voters is calculated to be approximately 72.87%.
Finally, the video covers the calculation of the probability of at least a certain number of voters.
The probability of at least four voters is found to be approximately 92.134%.
The video concludes with a promise to show the formula in a future video for those who need to understand the calculations.
Transcripts
Browse More Related Video
5.0 / 5 (0 votes)
Thanks for rating:


