Standard Deviation - Explained and Visualized
TLDRThis script explores the concept of standard deviation in statistics, illustrating its significance in determining the spread of data around the mean. It explains how standard deviation measures data dispersion and its application in identifying statistically significant outcomes, using examples like height comparisons and particle physics discoveries. The '68-95-99.7 rule' is highlighted to show data distribution, emphasizing the rarity of extreme deviations, such as the heights of LeBron James and Yao Ming, and the five-sigma results in particle physics signifying new findings.
Takeaways
- 🔍 Standard deviation is a statistical measure that quantifies the amount of variation or dispersion in a set of values.
- 📈 A low standard deviation indicates that data points are closely clustered around the mean, while a high standard deviation shows a wider spread.
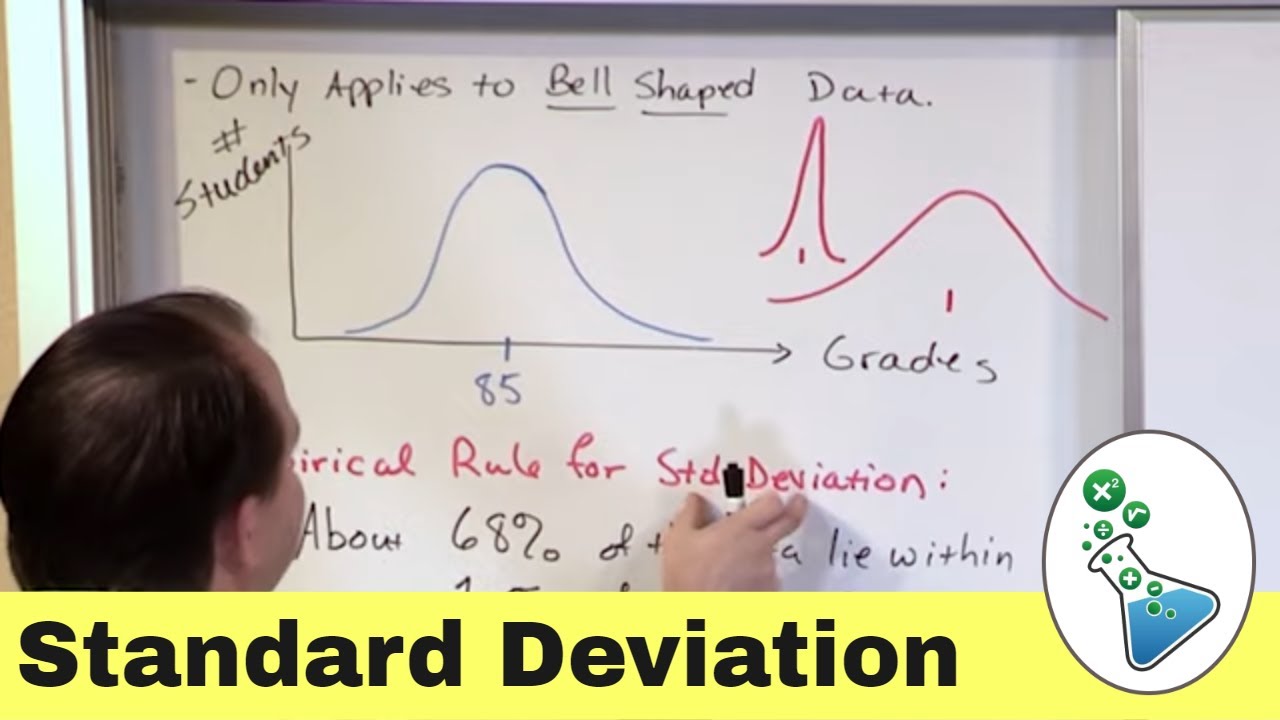
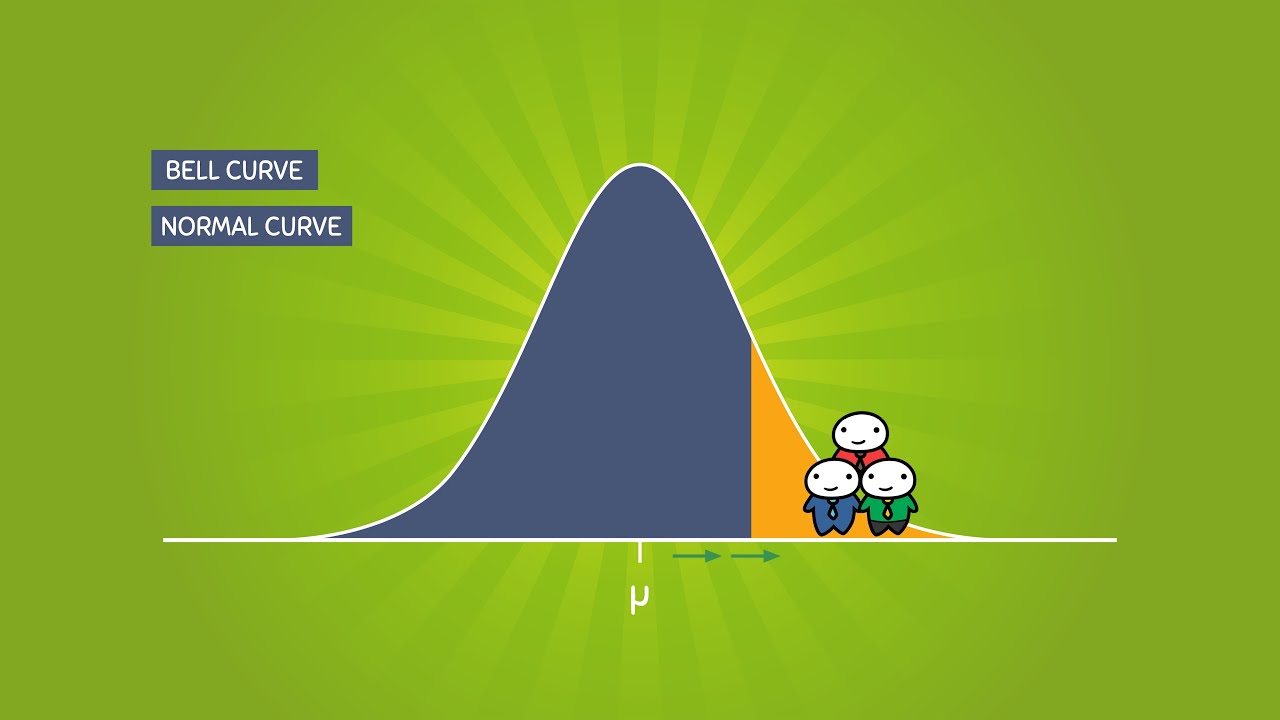
- 📊 The concept of standard deviation is particularly useful when data distribution is approximately normal, forming a bell curve.
- 📌 The Greek letter sigma (σ) is used to represent standard deviation, which helps measure how far a data point is from the mean in terms of standard deviation units.
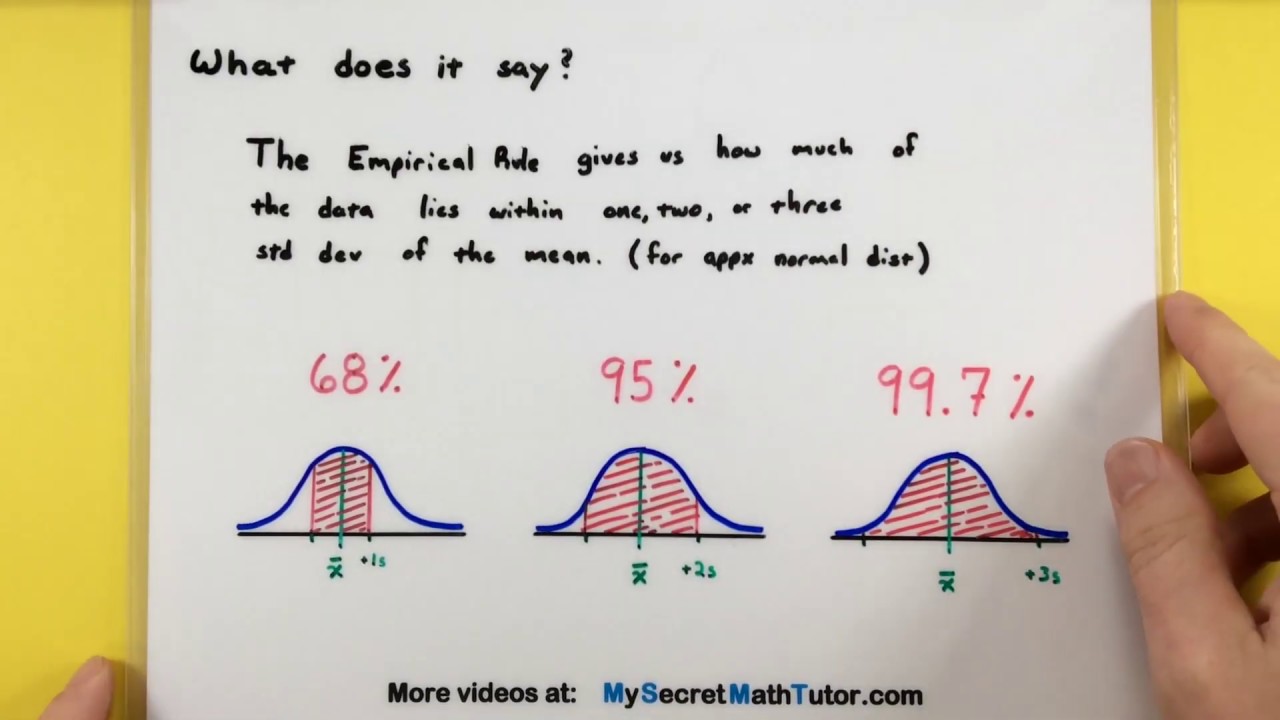
- 🌐 The 68-95-99.7 rule provides a quick way to understand the proportion of data within one, two, or three standard deviations from the mean.
- 📏 Using the 68-95-99.7 rule, it can be estimated that only about 0.3% of American men are more than nine inches taller or shorter than the average height of 5'10".
- 🤔 The script uses height as an example to illustrate how standard deviation can determine the rarity or commonality of certain traits, such as being taller than LeBron James or Yao Ming.
- 🔬 In particle physics, a 'five-sigma' result, which is five standard deviations from the mean, is considered a strong indicator of a discovery due to its low probability of being a random fluctuation.
- 🧐 The script emphasizes the importance of standard deviation in determining whether a value or result is statistically significant or just part of the expected variation.
- 📚 Understanding standard deviation helps in various fields, from manufacturing to sports, to identify outliers and assess the normalcy of observations.
- 🎓 The video script is educational, aiming to explain the concept of standard deviation and its applications in a clear and accessible manner.
Q & A
What is the concept of standard deviation in the context of data analysis?
-Standard deviation is a measure of the amount of variation or dispersion in a set of values. It indicates how spread out the data points are from the mean or average value of the dataset.
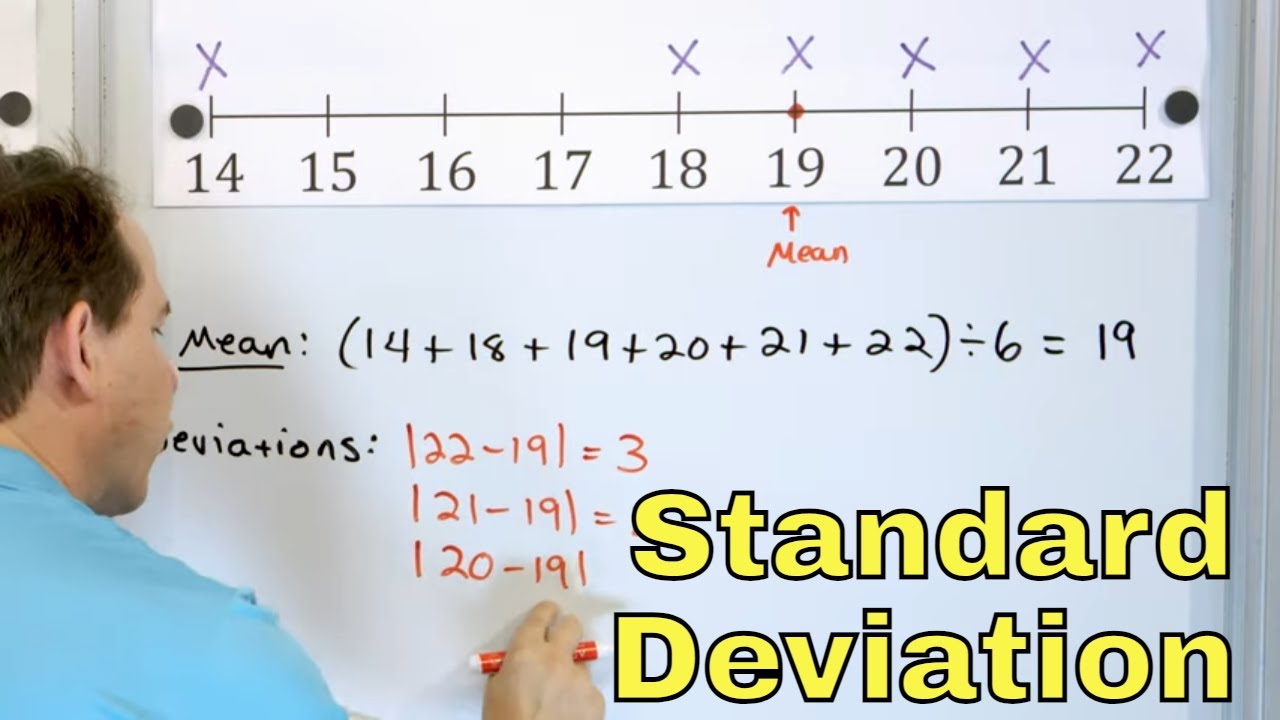
How is the mean calculated for a set of data?
-The mean is calculated by summing all the data points and then dividing by the total number of data points in the set.
What does a low standard deviation indicate about a set of data?
-A low standard deviation indicates that the data points are closely clustered around the mean, showing little variation.
How is standard deviation used in a normal distribution?
-In a normal distribution, which resembles a bell curve, standard deviation is used to understand the proportion of data points that fall within certain intervals from the mean, such as within one, two, or three standard deviations.
What does the '68-95-99.7 rule' signify in statistics?
-The '68-95-99.7 rule' states that in a normal distribution, approximately 68% of data fall within one standard deviation of the mean, 95% within two standard deviations, and 99.7% within three standard deviations.
How does the standard deviation help in determining the statistical significance of a data point?
-A data point's distance from the mean, measured in terms of standard deviations, helps determine if the point is a normal occurrence or an unusual outlier. Points that are several standard deviations away from the mean are considered statistically significant.
What is the average height of an American adult male, according to the script?
-The script states that the average height of an American adult male is 5'10" (177.8 cm).
What percentage of American men are taller than 6'7" according to the '68-95-99.7 rule'?
-According to the '68-95-99.7 rule', approximately 0.15% of American men are taller than 6'7" (200.66 cm).
What is the significance of a 'five-sigma' result in particle physics?
-A 'five-sigma' result in particle physics indicates a discovery, as it represents a result that is five standard deviations away from the mean, which has a very low probability (1 in 3.5 million) of being due to random fluctuation.
How does the concept of standard deviation apply to the discovery of new particles in physics?
-In particle physics, a significant result, such as a 'five-sigma' result, indicates a potential discovery because it is unlikely to be a random fluctuation, suggesting that the observed particle is not part of the expected variation.
What is the script's final takeaway on the importance of standard deviation?
-The script emphasizes that standard deviation, along with the mean, allows us to determine whether a value is statistically significant or part of expected variation, which is crucial in various fields, including physics and data analysis.
Outlines
📊 Understanding Standard Deviation in Data Analysis
This paragraph introduces the concept of standard deviation as a measure of data spread, explaining its significance in determining how values are distributed around the mean. It uses an example of people's wallet amounts to illustrate the calculation of mean and standard deviation. The paragraph further explains the concept of a normal distribution and how standard deviation helps in understanding whether a data point is common or unusual. It discusses the '68-95-99.7 rule', which provides probabilities for data falling within certain standard deviations from the mean, and applies this to the average height of American men to show how few individuals significantly deviate from the norm. The paragraph concludes by connecting the concept to particle physics, where a 'five-sigma' result is considered a strong indicator of a discovery due to its low probability of being a random fluctuation.
Mindmap
Keywords
💡Standard Deviation
💡Mean
💡Bell Curve
💡Sigma (Σ)
💡68-95-99.7 Rule
💡Statistical Significance
💡Particle Physics
💡Data Points
💡Manufacturing Process
💡Expected Variation
💡Height Comparison
Highlights
The concept of standard deviation is introduced as a method to answer questions about data distribution.
Mean and standard deviation can be calculated for any set of data, as exemplified by a group's wallet amounts.
Standard deviation measures the spread or dispersion of data points around the mean.
A low standard deviation indicates data points are closely clustered around the mean.
A high standard deviation shows that data points are spread over a wider range.
Standard deviation is used when data distribution is approximately normal, resembling a bell curve.
The Greek letter Sigma represents standard deviation.
Data points' distance from the mean can be measured in terms of standard deviations.
Data beyond certain standard deviations from the mean are considered significantly above or below average.
The 68-95-99.7 rule is explained, detailing the percentage of data within one, two, and three standard deviations of the mean.
Using the 68-95-99.7 rule, it's estimated that only 0.3% of American men deviate more than nine inches from the average height.
LeBron James and Yao Ming's heights are compared to the average, suggesting their rarity in the population.
In particle physics, a five-sigma result is considered a significant discovery, with a 1 in 3.5 million chance of being random.
Standard deviation, along with the mean, helps determine if a value is statistically significant or part of expected variation.
The video concludes by summarizing the importance of standard deviation in understanding data spread and significance.
The video was created using Powtoon, a tool for creating animated presentations.
Transcripts
Browse More Related Video
Empirical Rule of Standard Deviation in Statistics

Elementary Statistics - Chapter 6 Normal Probability Distributions Part 1
The Normal Distribution and the 68-95-99.7 Rule (5.2)
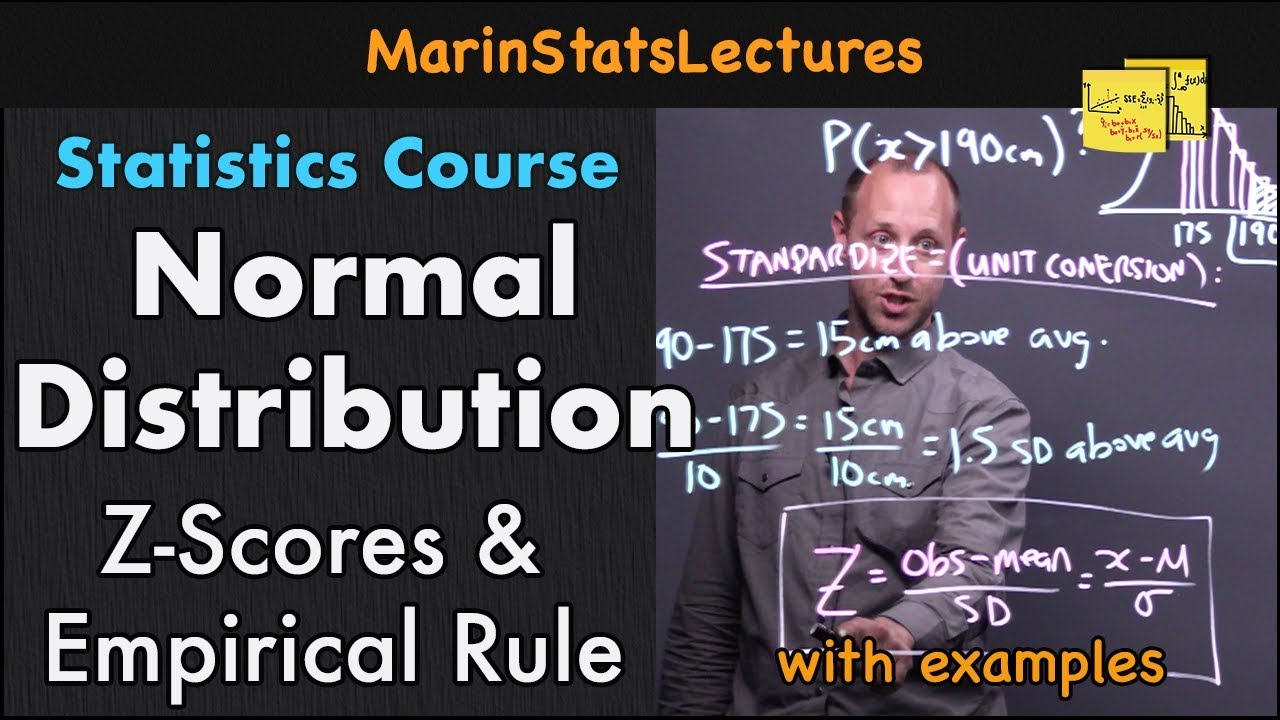
Normal Distribution, Z-Scores & Empirical Rule | Statistics Tutorial #3 | MarinStatsLectures
Statistics - How to use the Empirical Rule
Standard Deviation & Mean Absolute Deviation Explained - 6-8-19]
5.0 / 5 (0 votes)
Thanks for rating: