Normal Distribution, Z-Scores & Empirical Rule | Statistics Tutorial #3 | MarinStatsLectures
TLDRThe video introduces the concept of the normal distribution, using the example of population heights. It explains how the mean (175 cm) and standard deviation (10 cm) define the distribution's center and spread. The 68-95-99.7 rule is highlighted to show the probability of observations falling within certain ranges of standard deviations from the mean. The video then discusses standardizing values to understand the likelihood of specific outcomes, such as the probability of a randomly selected individual being over 190 cm, which is found to be 6.7%.
Takeaways
- 📈 The normal distribution is a theoretical probability distribution that helps predict outcomes from sample data when the population parameters are known.
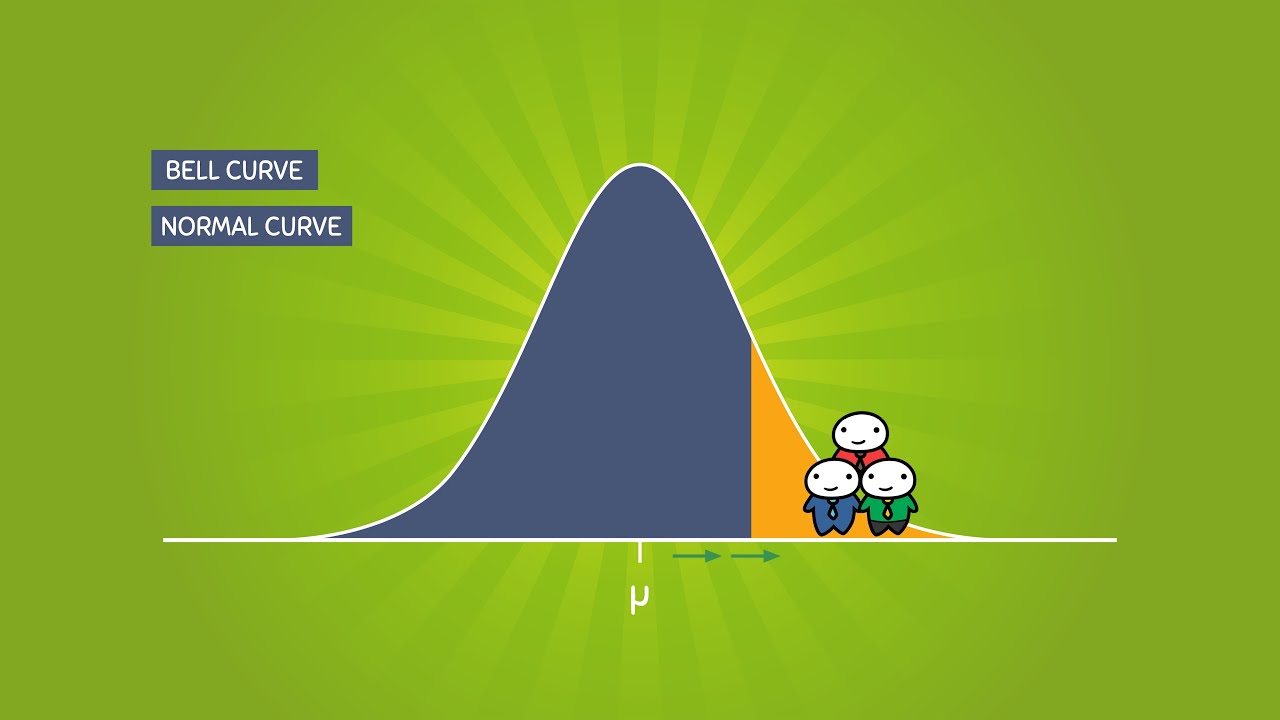
- 🔢 A population's height, with a mean of 175 cm and standard deviation of 10 cm, is an example of a normal distribution that is bell-shaped and symmetric around the mean.
- 📊 The mean of a normal distribution indicates the center of the distribution, while the standard deviation reflects the spread or variability of the data.
- 🌐 As the standard deviation increases, the normal distribution becomes wider; as it decreases, the distribution becomes narrower.
- 📏 The 68-95-99.7 rule of thumb for normal distribution states that approximately 68%, 95%, and 99.7% of observations fall within one, two, and three standard deviations from the mean, respectively.
- 🤔 The probability of selecting an individual taller than 190 cm from a population with a normal distribution can be calculated using the standard deviation and mean.
- 📐 Standardizing is the process of converting raw scores to a new scale with a mean of zero and a standard deviation of one, which helps in comparing scores across different units or distributions.
- 🔄 Converting units from centimeters to inches, for example, does not change the shape of the distribution, reinforcing the idea that unit conversion does not affect the underlying distribution.
- 📊 To find the probability of an event like a height greater than 190 cm, one can calculate the number of standard deviations away from the mean and use that to find the probability.
- 🧮 The probability of an individual being 190 cm or more tall in the given population is approximately 6.7%, which can be determined using a Z-table or statistical software.
- 🎯 The focus of the script is on understanding the concepts behind normal distribution and standardizing, rather than the technicalities of calculating probabilities from tables or software.
Q & A
What is the normal distribution and how is it represented?
-The normal distribution is a theoretical probability distribution that is bell-shaped and perfectly symmetric about its mean. It is often used to model real-world data, such as the heights of a population in the given example.
What are the two key parameters of the normal distribution?
-The two key parameters of the normal distribution are the mean and the standard deviation. The mean determines the center of the distribution, while the standard deviation describes the spread or variability of the data.
How does the standard deviation affect the width of the normal distribution?
-As the standard deviation increases, the normal distribution becomes wider, and as it decreases, the distribution becomes narrower. The standard deviation is a measure of how spread out the data is from the mean.
What is the 68-95-99.7 rule in the context of the normal distribution?
-The 68-95-99.7 rule, also known as the one, two, three standard deviation rule, states that approximately 68% of observations fall within one standard deviation of the mean, about 95% within two standard deviations, and nearly 99.7% within three standard deviations.
How can we calculate the probability of an individual's height being within a certain range in a normal distribution?
-To calculate the probability of an individual's height falling within a certain range, we can use the properties of the normal distribution and the standard deviation. By identifying the range in terms of standard deviations from the mean, we can estimate the percentage of the population that falls within that range.
What is the concept of standardizing in the context of the normal distribution?
-Standardizing in the context of the normal distribution involves converting raw scores to a standard score, which is the number of standard deviations an observation is from the mean. This process helps in comparing scores across different scales or units of measurement.
How can we find the probability of an individual being taller than 190 centimeters given the population mean and standard deviation?
-We can find the probability by first calculating the standard score for 190 centimeters, which is 1.5 standard deviations above the mean (190 - 175) / 10. Then, using a Z-table or statistical software, we can find the probability associated with being 1.5 standard deviations above the mean, which is approximately 6.7%.
Why is it important to understand the properties of the normal distribution in statistical analysis?
-Understanding the properties of the normal distribution is crucial because it allows us to make inferences about a population based on a sample, perform hypothesis testing, and estimate probabilities. It is a fundamental concept in many statistical methods and provides a basis for comparing and interpreting data.
What is the significance of the mean and standard deviation in real-world applications of the normal distribution?
-In real-world applications, the mean and standard deviation provide a summary of the central tendency and variability of the data. They are essential for making predictions, understanding data patterns, and identifying outliers, which can have significant implications in fields such as finance, healthcare, and social sciences.
How can we use the normal distribution to predict outcomes in a population?
-By knowing the mean and standard deviation of a normally distributed population, we can predict the likelihood of outcomes within certain ranges. This is useful for risk assessment, quality control, and making informed decisions based on statistical probabilities.
What are the limitations of using the normal distribution as a model for real-world data?
-While the normal distribution is a powerful tool, it is an assumption that not all data follow this distribution. Some data may be skewed, have multiple peaks, or have other shapes that do not conform to the normal distribution, which can lead to inaccurate predictions and interpretations if this assumption is not met.
Outlines
📊 Introduction to Normal Distribution
This paragraph introduces the concept of the normal distribution, a theoretical probability distribution that is symmetric and bell-shaped. It uses the example of a population's height distribution, which is known to be normal with a mean of 175 cm and a standard deviation of 10 cm. The video explains the properties of the normal distribution, emphasizing the roles of the mean and standard deviation in determining the distribution's center and spread. It introduces the 68-95-99.7 rule, which describes the percentage of observations within one, two, and three standard deviations from the mean, respectively. The main point is to understand how samples behave and to calculate the likelihood of observing certain outcomes, such as an individual's height being greater than 190 cm, based on the known population parameters.
📐 Standardizing and Z-Scores
The second paragraph delves into the concept of standardizing data, which involves converting raw scores into z-scores to facilitate comparisons and calculations. It explains how to calculate z-scores by measuring the distance from the mean in terms of standard deviations. Using the example from the previous paragraph, it shows how a height of 190 cm translates to 1.5 standard deviations above the mean. The paragraph emphasizes that standardized heights should also follow a normal distribution. It concludes by discussing how to find the probability of an individual being 190 cm or taller, which is equivalent to finding the probability of being 1.5 standard deviations above the mean. The probability is given as 6.7%, highlighting that approximately 6.7% of the population will be 190 cm or taller. The paragraph mentions the use of a Z-table or software for such calculations but focuses on the conceptual understanding rather than the calculation method.
Mindmap
Keywords
💡Normal Distribution
💡Mean
💡Standard Deviation
💡Histogram
💡68-95-99.7 Rule
💡Observations
💡Unit Conversion
💡Standardizing
💡Z-Score
💡Probability
💡Z-Table
Highlights
Introduction to the normal distribution as a theoretical probability distribution.
Using the example of heights in a population, which are normally distributed with a mean of 175 cm and a standard deviation of 10 cm.
Explanation of the properties of normal distribution, including its bell-shaped and symmetric nature around the mean.
Discussion on how the standard deviation affects the spread of the normal distribution.
The 68-95-99.7 rule for understanding the proportion of observations within one, two, and three standard deviations from the mean.
Application of normal distribution to estimate probabilities, such as the likelihood of an individual being taller than 190 cm.
Concept of standardizing data by converting observations to how many standard deviations they are from the mean.
Illustration of how unit conversion (e.g., cm to inches) does not change the shape of the distribution.
Explanation of Z-score as a measure of how far an observation is from the mean in terms of standard deviations.
Use of Z-scores to calculate the probability of an individual being 190 cm or taller in a population.
Demonstration of converting a height measurement (190 cm) into a Z-score (1.5 standard deviations above the mean).
Calculation of the probability of being one and a half standard deviations above the mean, resulting in 6.7%.
Mention of using a Z-table or software (like R) to find probabilities associated with Z-scores.
Emphasis on understanding the concepts behind normal distribution and standardization rather than the technicalities of finding probabilities.
The practical application of normal distribution in understanding sample behavior and making probabilistic predictions.
The importance of visualizing data distribution and understanding the implications of statistical parameters like mean and standard deviation.
Transcripts
Browse More Related Video
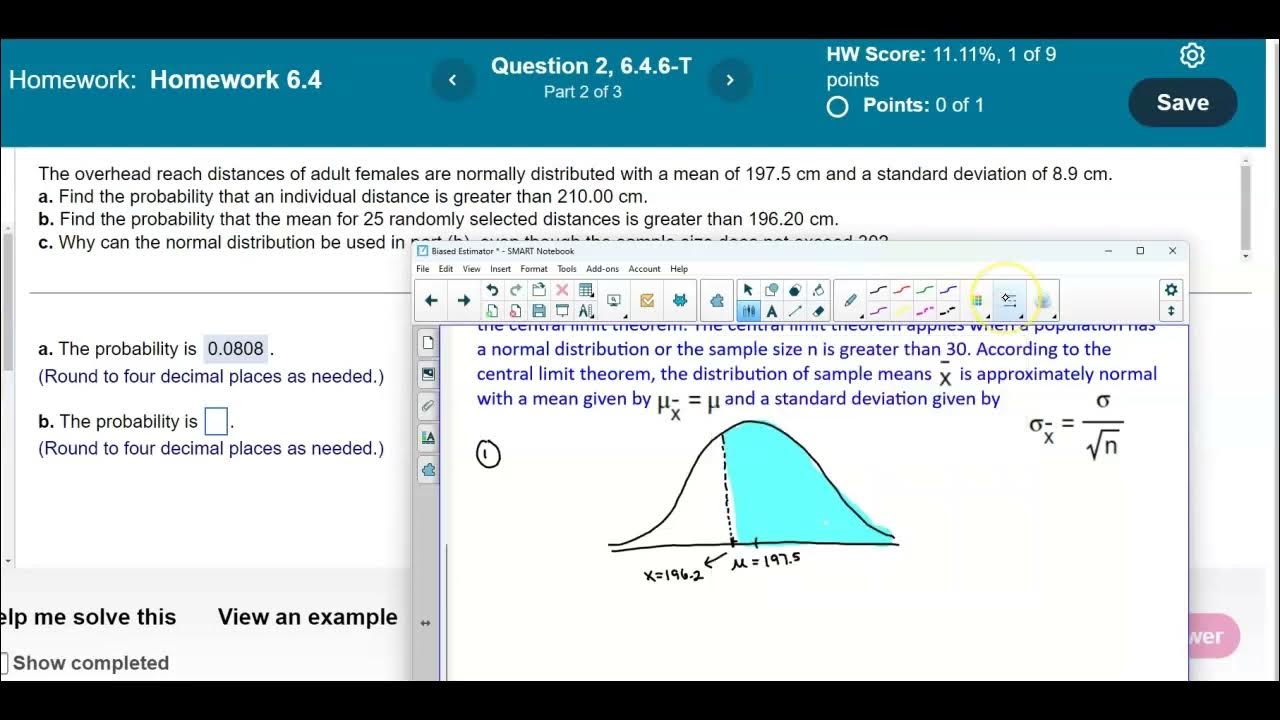
Math 14 HW 6.4.6-T Using the Central Limit Theorem
Probabilities from density curves | Random variables | AP Statistics | Khan Academy

Standard Deviation - Explained and Visualized
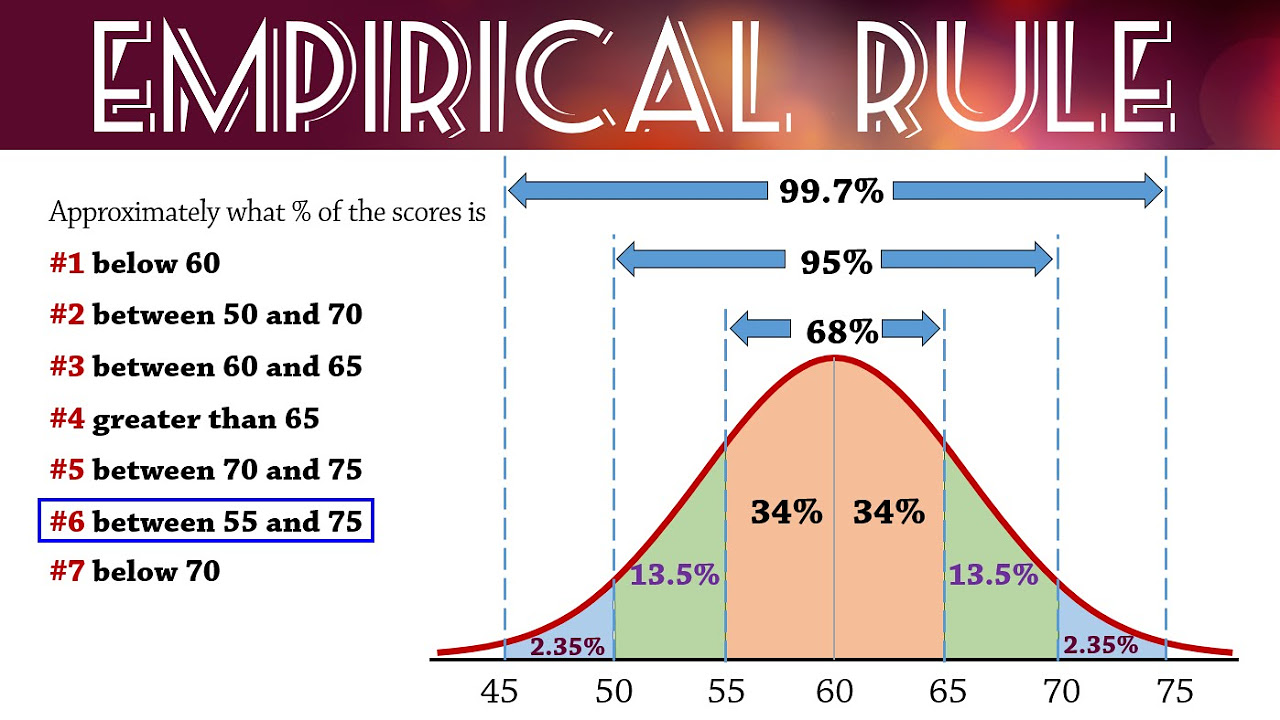
Empirical Rule (68-95-99.7) for Normal Distributions
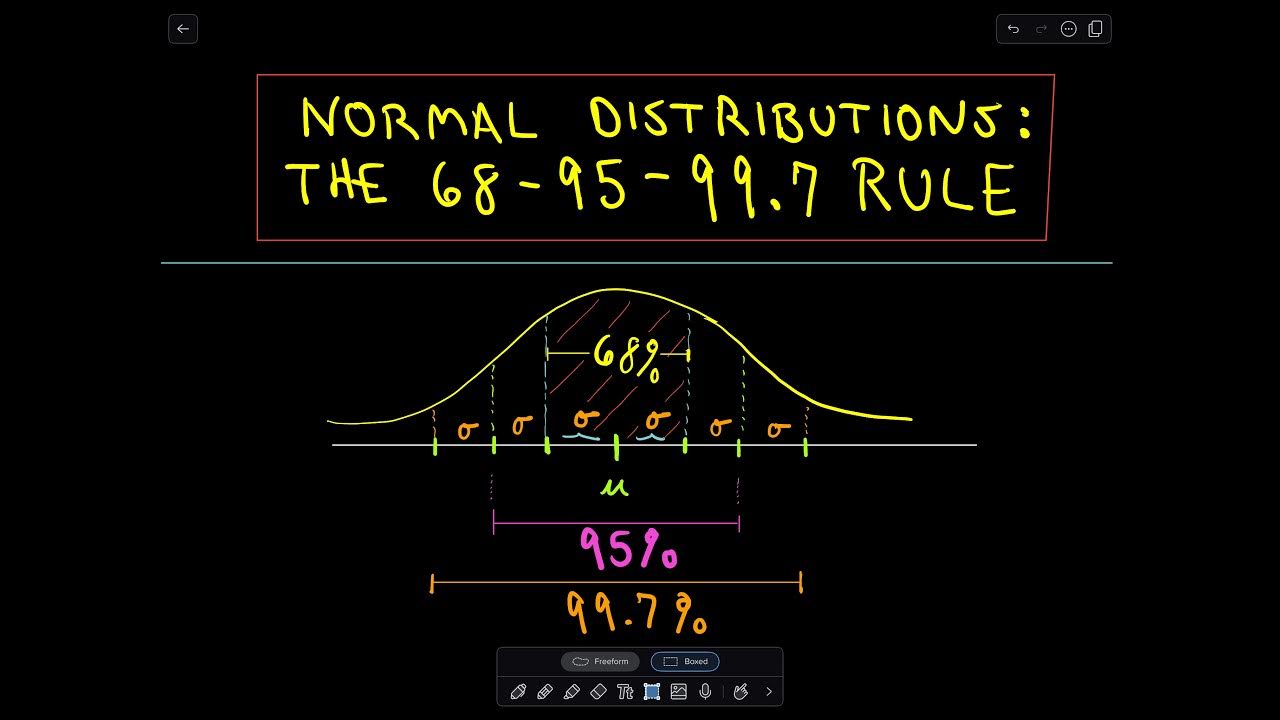
The Normal Distribution and the 68-95-99.7 Rule
The Normal Distribution and the 68-95-99.7 Rule (5.2)
5.0 / 5 (0 votes)
Thanks for rating: