Statistics - How to use the Empirical Rule
TLDRThis video tutorial introduces the Empirical Rule for normal distributions, explaining that approximately 68% of data falls within one standard deviation of the mean, 95% within two, and 99.7% within three. It demonstrates the rule's application through examples, such as analyzing exam grades and women's heights, to estimate the range of values that include a significant percentage of the data set. The Empirical Rule is presented as a valuable tool for understanding data distribution around the mean.
Takeaways
- 📚 The empirical rule is a statistical tool used to understand the distribution of data in normal distributions.
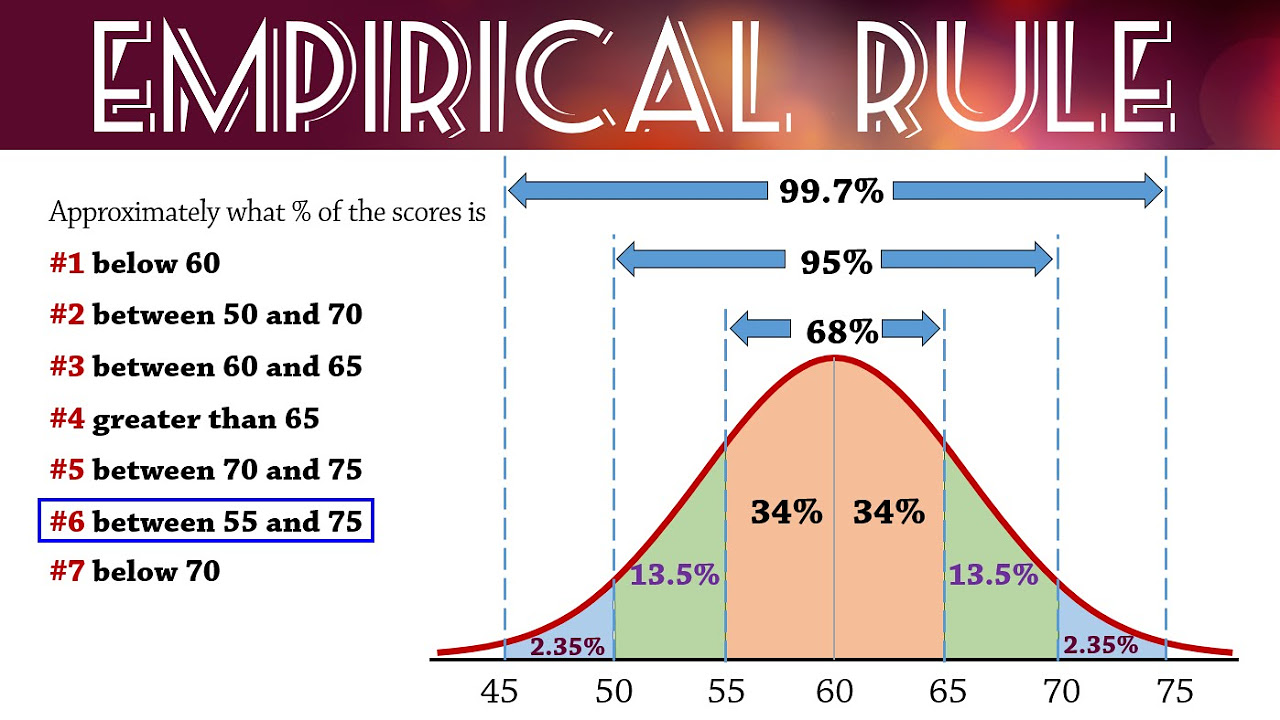
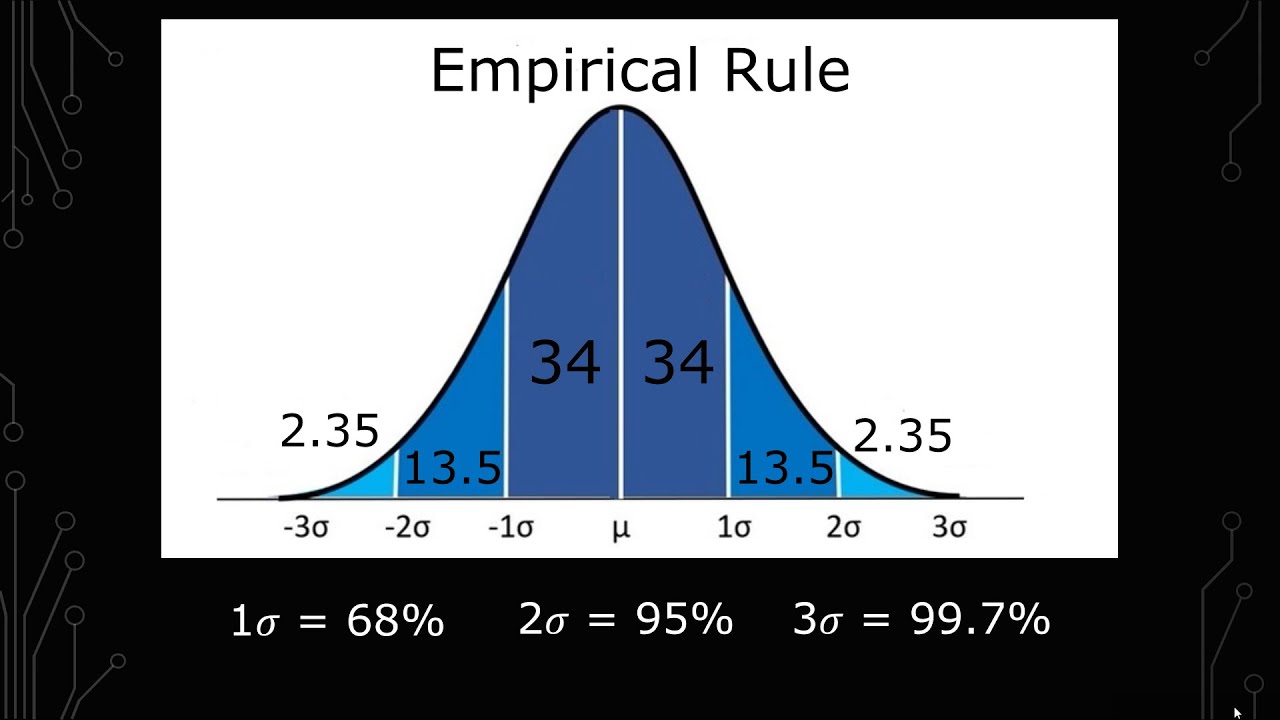
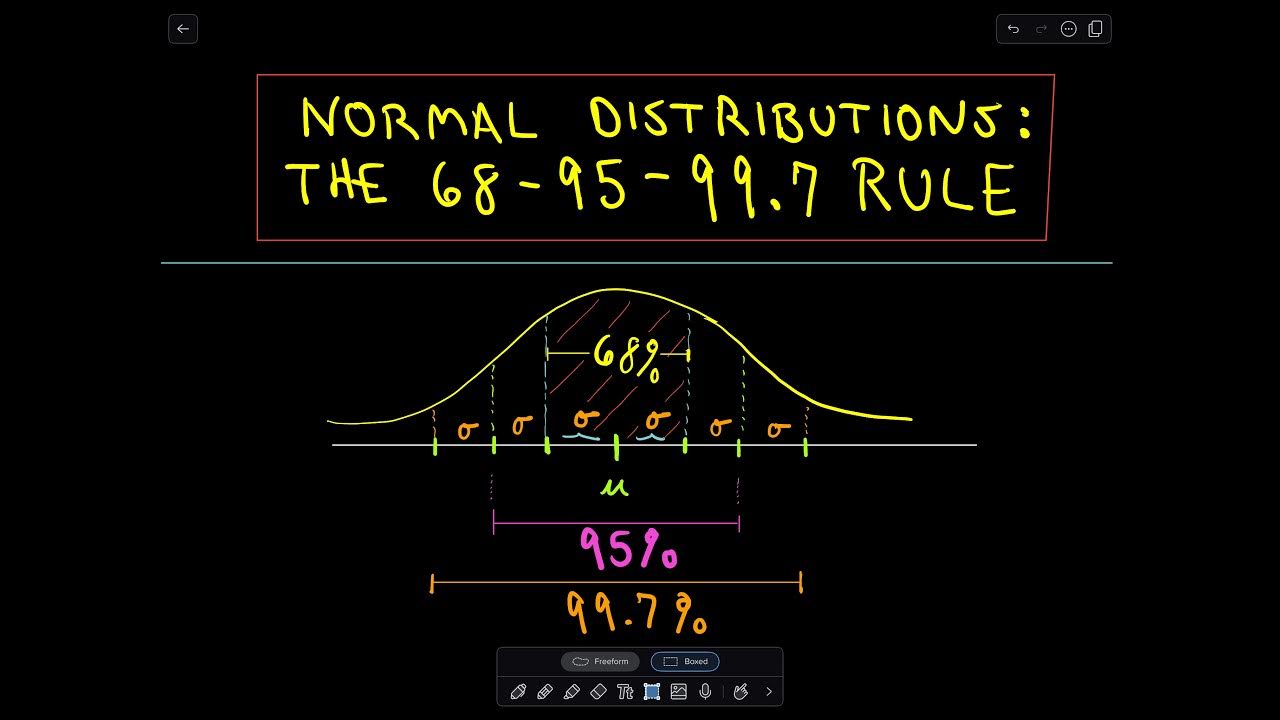
- 📉 It states that approximately 68% of data falls within one standard deviation of the mean in a normal distribution.
- 📈 Expanding this, about 95% of the data is found within two standard deviations of the mean.
- 🌐 Furthermore, the empirical rule suggests that 99.7% of data is within three standard deviations of the mean.
- 🔍 The rule is particularly useful for estimating the range of values that include a significant percentage of data points around the mean.
- 📝 An example given in the script involves calculating the range of grades for a history exam, which follows a normal distribution with a mean of 78 and a standard deviation of 6.
- 🧮 For the history exam example, the empirical rule is applied to find that grades between 66 and 90 include approximately 95% of all grades.
- 📊 Another example provided discusses the heights of women, which also follow a normal distribution with a mean of 160 cm and a standard deviation of 7.5 cm.
- 🤔 In the women's height example, the script calculates that 99.7% of women are within the range of 137.5 cm to 182.5 cm, which is three standard deviations from the mean.
- 📋 The script emphasizes the importance of identifying the mean and standard deviation when dealing with normal distributions to apply the empirical rule effectively.
- 🔑 The empirical rule provides a quick approximation and is not always exact, but it is a reliable method for estimating data distribution around the mean.
Q & A
What is the Empirical Rule?
-The Empirical Rule is a guideline that provides the proportion of data within one, two, or three standard deviations of the mean in a normal distribution. It states that approximately 68% of the data falls within one standard deviation, 95% within two standard deviations, and 99.7% within three standard deviations of the mean.
Why is the Empirical Rule significant in statistics?
-The Empirical Rule is significant because it helps to quickly estimate the distribution of data around the mean without having to perform complex calculations or analyze the entire dataset, making it a useful tool for understanding the spread of data in normal distributions.
What are the prerequisites for applying the Empirical Rule?
-The Empirical Rule can only be applied to data that follows a normal distribution. It requires knowledge of the mean and standard deviation of the dataset.
In the context of the video, what does it mean to say that grades follow a 'normal distribution'?
-Saying that grades follow a 'normal distribution' implies that the grades are symmetrically distributed around a central mean, with the majority of grades near the mean and fewer grades as one moves away from the mean in either direction.
What is the mean and standard deviation of the history exam grades mentioned in the video?
-The mean of the history exam grades is 78, and the standard deviation is 6.
How can you find the range of grades that includes 95% of the students according to the Empirical Rule?
-To find the range that includes 95% of the students, you subtract and add two times the standard deviation from the mean. For the history exam, this would be 78 - (2 * 6) for the lower bound and 78 + (2 * 6) for the upper bound, resulting in a range of 66 to 90.
What does the video suggest about the accuracy of the Empirical Rule?
-The video suggests that while the Empirical Rule provides a good approximation, it may not be exactly accurate for real data, but it should be close enough for most practical purposes.
What is the mean and standard deviation for the women's heights in the second example of the video?
-The mean height of the women is 160 centimeters, and the standard deviation is 7.5 centimeters.
How can you determine the percentage of women with heights between 137.5 cm and 182.5 cm using the Empirical Rule?
-You first determine how many standard deviations away the given range is from the mean. In this case, the upper limit (182.5 cm) is three standard deviations away from the mean (160 + (3 * 7.5)). According to the Empirical Rule, this range would include approximately 99.7% of the women.
What does the video imply about the shape of the distribution for women's heights?
-The video implies that the distribution of women's heights is bell-shaped, which is another way of saying it follows a normal distribution.
How can the Empirical Rule be used to approximate the percentage of a dataset within a certain range?
-The Empirical Rule can be used by identifying the number of standard deviations the range extends from the mean and then referencing the rule's percentages for one, two, or three standard deviations to approximate the percentage of the dataset within that range.
Outlines
📚 Introduction to the Empirical Rule
This paragraph introduces the empirical rule for normal distributions, explaining its purpose and basic concept. The empirical rule is a statistical tool that helps to understand the distribution of data around the mean within one, two, or three standard deviations. It states that approximately 68% of data falls within one standard deviation of the mean, 95% within two standard deviations, and 99.7% within three standard deviations. The paragraph sets the stage for examples that will demonstrate how to apply this rule in practical scenarios.
📝 Applying the Empirical Rule to Exam Grades
The first example provided in the script applies the empirical rule to the grades of a history exam, which are normally distributed with a mean of 78 and a standard deviation of 6. The goal is to determine the range of grades that includes 95% of students, which corresponds to two standard deviations from the mean. By subtracting and adding two times the standard deviation from the mean, the range of 66 to 90 is identified. This range is expected to capture the majority of the grades, illustrating the empirical rule's utility in estimating data distribution.
📏 Estimating Heights with the Empirical Rule
The second example discusses the heights of women, which are also normally distributed with a mean of 160 centimeters and a standard deviation of 7.5 centimeters. The task is to find the percentage of women with heights between 137.5 and 182.5 centimeters. By calculating the number of standard deviations that correspond to this range, it is determined that the upper limit is three standard deviations from the mean. According to the empirical rule, this range should include approximately 99.7% of the data, providing a strong approximation of the percentage of women within this height range.
Mindmap
Keywords
💡Empirical Rule
💡Normal Distribution
💡Standard Deviation
💡Mean
💡68-95-99.7 Rule
💡Range
💡Bell-Shaped Curve
💡Percentage
💡Deviation
💡Approximation
Highlights
Introduction to the empirical rule for normal distributions.
Explanation of the empirical rule stating 68% of data lies within one standard deviation of the mean.
Clarification that 95% of data is within two standard deviations according to the empirical rule.
Mention of 99.7% of data being within three standard deviations as per the empirical rule.
Introduction of the first example involving grades for a history exam.
Emphasis on the importance of the normal distribution for applying the empirical rule.
Identification of the mean and standard deviation for the history exam grades.
Calculation to find the range of grades that include 95% of all grades using two standard deviations.
Conclusion that grades between 66 and 90 capture 95% of all grades as an approximation.
Introduction of the second example regarding the heights of women.
Reiteration of the bell-shaped distribution indicating a normal distribution for women's heights.
Identification of the mean and standard deviation for women's heights.
Approach to determine the percentage of women within a given height range using the empirical rule.
Calculation to find the number of standard deviations for the upper height limit.
Conclusion that approximately 99.7% of women fall within the specified height range.
Final remarks on the empirical rule's usefulness as an approximation for data distribution.
Invitation to visit the math tutor's website for more educational content.
Transcripts


5.0 / 5 (0 votes)
Thanks for rating: