The Normal Distribution and the 68-95-99.7 Rule (5.2)
TLDRThis video script introduces the concept of normal distribution and the 68-95-99.7 rule, explaining the difference between population parameters and sample statistics. It describes the bell-shaped curve of normal distribution, emphasizing the significance of the population mean (mu) and standard deviation (Sigma) in determining the position and spread of the distribution. The script also illustrates how these concepts apply to real-world data, such as exam scores and height, and provides practice questions to help viewers understand and apply the 68-95-99.7 rule for approximating areas under the normal curve.
Takeaways
- 📈 The normal distribution is a bell-shaped density curve that describes how data tends to cluster around a central value, the population mean (μ).
- 🔄 Parameters vs. Statistics: Parameters (μ, σ) describe the population, while statistics (sample mean, sample standard deviation) describe a sample.
- 🌟 The position of the normal distribution is determined by the population mean (μ), which is always at the center of the curve.
- 📊 The spread of the normal distribution is characterized by the population standard deviation (σ), with larger σ indicating a more spread-out distribution.
- 📈 The total area under the normal distribution curve equals one (or 100%), reflecting the fact that all possible outcomes are accounted for.
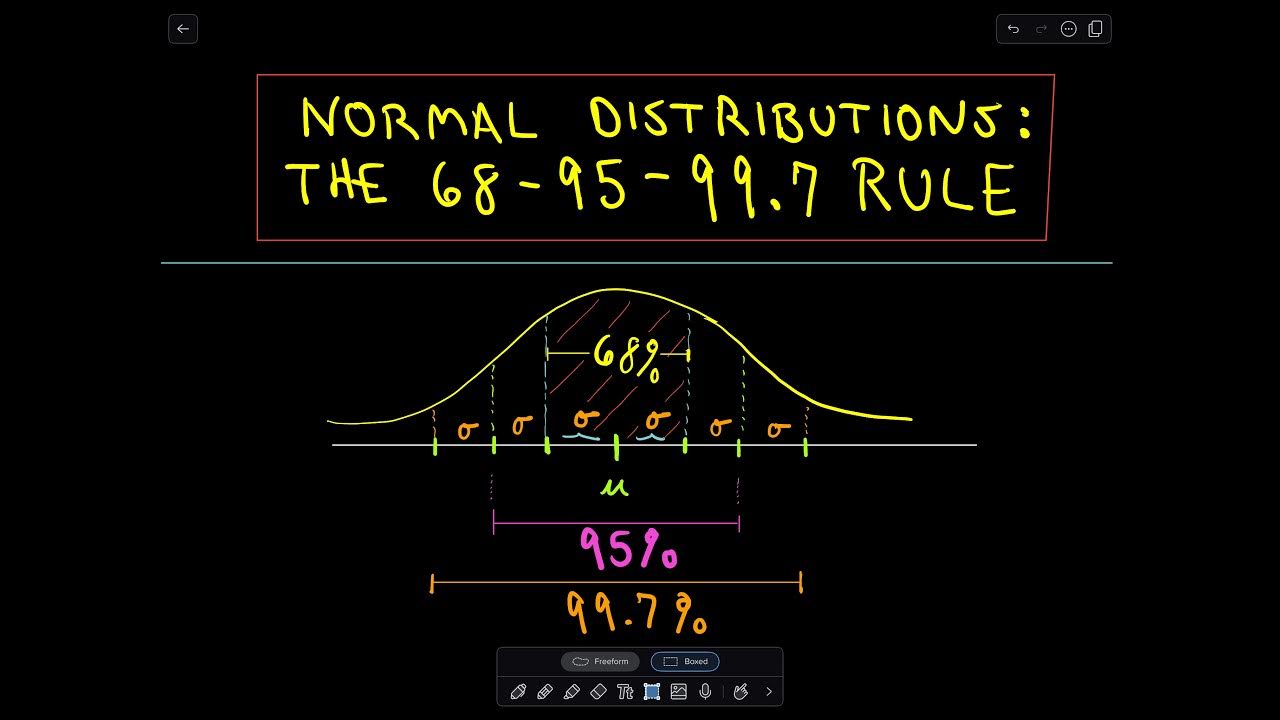
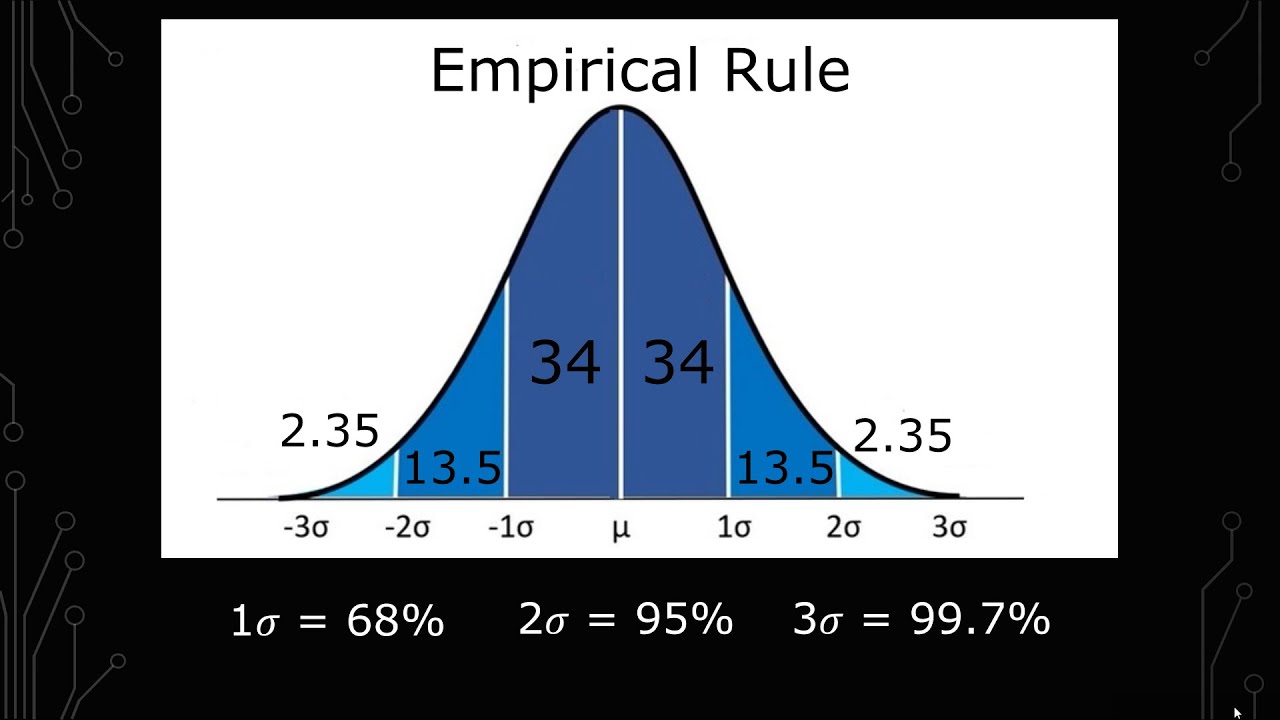
- 📚 The 68-95-99.7 rule: Within one standard deviation of the mean, approximately 68% of the data falls; within two standard deviations, about 95%; and within three standard deviations, nearly 99.7%.
- 🤔 The normal distribution is never touched by the x-axis and extends infinitely in both directions, though the areas beyond three standard deviations are very small.
- 📝 The 68-95-99.7 rule is a useful approximation for calculating areas under the normal distribution curve and is applicable to any normal distribution, regardless of shape or size.
- 📊 The normal distribution is unimodal and symmetric about its mean, meaning the left and right tails mirror each other.
- 🔍 The shape of the normal distribution is influenced by many natural variables, making it a common choice for modeling various types of data, such as exam scores and physical measurements.
- 📌 Practice questions are provided to apply the understanding of the normal distribution and the 68-95-99.7 rule to real-world scenarios.
Q & A
What is the difference between a parameter and a statistic?
-A parameter is a numerical characteristic that describes the entire population, while a statistic describes a sample taken from that population. For example, the population mean (mu) and population standard deviation (Sigma) are parameters, whereas the sample mean (x-bar) and sample standard deviation (s) are statistics.
What is a normal distribution?
-A normal distribution is a type of density curve that is bell-shaped, which describes the tendency for data to cluster around a central value, known as the population mean (mu). It is a common way to model many naturally occurring phenomena, such as heights, weights, and exam scores.
How does the population mean (mu) affect the normal distribution?
-The population mean (mu) determines the position of the normal distribution on the number line. If the mean increases, the curve shifts to the right, and if it decreases, the curve shifts to the left, always centering around the mean value.
What characterizes the spread of a normal distribution?
-The population standard deviation (Sigma) characterizes the spread of the normal distribution. A larger standard deviation results in a more spread-out distribution, while a smaller standard deviation results in a less spread-out, or more concentrated, distribution.
What does the 68-95-99.7 rule describe in the context of a normal distribution?
-The 68-95-99.7 rule states that in a normal distribution, approximately 68% of the data falls within one standard deviation of the mean, 95% within two standard deviations, and 99.7% within three standard deviations.
What happens when considering data points more than three standard deviations away from the mean in a normal distribution?
-Although a normal distribution never touches the x-axis and extends indefinitely in both directions, the probability of finding data points more than three standard deviations away from the mean is very small, and they become increasingly rare as you move further out.
How can the 68-95-99.7 rule be used to approximate areas under the normal curve?
-The 68-95-99.7 rule provides a quick way to estimate the proportion of data within certain ranges around the mean for a normal distribution. By knowing the percentage of data within one, two, or three standard deviations, we can approximate the area between any two points on the distribution curve.
What is the significance of the normal distribution being symmetric about its mean?
-The symmetry of the normal distribution about its mean implies that the distribution is perfectly balanced around the central value. This means that the likelihood of a data point occurring equally far above the mean is the same as it is below the mean.
How does the total area under a normal distribution curve relate to the standard deviation and the shape of the curve?
-The total area under a normal distribution curve is always equal to 1 (or 100%). As the standard deviation increases, the curve becomes more spread out and flatter, and as it decreases, the curve becomes taller and narrower. This is because the area under the curve must remain constant, so wider curves are less tall, and vice versa.
What is the notation for a normal distribution with a given mean (mu) and standard deviation (Sigma)?
-The notation for a normal distribution with a given mean mu and standard deviation Sigma is written as X ~ N(mu, Sigma), indicating that the variable X follows a normal distribution with parameters mu and Sigma.
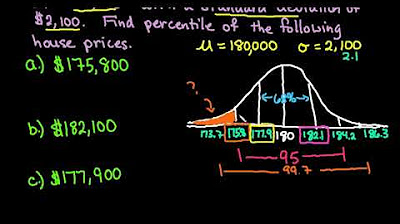
In the context of the video, what is the practical application of the normal distribution and the 68-95-99.7 rule?
-The practical application of the normal distribution and the 68-95-99.7 rule is to make predictions and estimations about data sets that are normally distributed. For example, it can be used to determine the percentage of a population that falls within certain ranges of a measured variable, such as heights or test scores.
Outlines
📊 Introduction to Normal Distribution and 68-95-99.7 Rule
This paragraph introduces the concept of the normal distribution, also known as the bell curve, and explains its significance in statistics. It differentiates between parameters (like the population mean μ and standard deviation Σ) and statistics (such as the sample mean x-bar and sample standard deviation s). The paragraph emphasizes the importance of these parameters in describing normally distributed populations and explains how the position and spread of the normal distribution are determined by μ and Σ, respectively. It also touches on the unimodal and symmetric nature of the normal curve and how it can be characterized by these parameters.
📈 Understanding the 68-95-99.7 Rule in Normal Distribution
This paragraph delves into the 68-95-99.7 rule, which is a statistical rule that helps in approximating the areas under the normal distribution curve. It explains how within one standard deviation of the mean, 68% of the data lies, two standard deviations encompass 95% of the data, and three standard deviations contain 99.7% of the data. The paragraph uses the example of student heights to illustrate these percentages. It also discusses the implications of moving beyond three standard deviations from the mean and how the area under the curve, though technically infinite, becomes very small and less significant.
Mindmap
Keywords
💡Normal Distribution
💡Parameter vs. Statistic
💡Population Mean (μ)
💡Population Standard Deviation (σ)
💡68-95-99.7 Rule
💡Density Curve
💡Symmetric Distribution
💡Unimodal Distribution
💡Standard Deviation Intervals
💡Probability and Area
💡Practice Questions
Highlights
The video discusses the normal distribution and the 68-95-99.7 rule.
Normal distribution refers to data from a population or sample.
Parameters are numbers that describe a population, while statistics describe a sample.
The sample mean is represented by x-bar, and the sample standard deviation by s.
Population mean (mu) and population standard deviation (Sigma) are represented by Greek letters.
A normal distribution is bell-shaped, often called the bell curve or normal curve.
The normal distribution describes how data clusters around the central value, the population mean.
Examples of variables that follow a normal distribution include weight, height, and blood pressure.
The population mean (mu) determines the position of the normal distribution.
The population standard deviation (Sigma) determines the spread of the normal distribution.
A normal distribution is unimodal and symmetric about its mean.
The 68-95-99.7 rule states that within one, two, and three standard deviations from the mean, 68%, 95%, and 99.7% of the data falls, respectively.
The normal distribution never touches the x-axis and extends to infinity.
The 68-95-99.7 rule is a method for approximating the areas under a normal distribution curve.
The video includes practice questions to apply the concepts of normal distribution and the 68-95-99.7 rule.
The video provides a clear explanation of the relationship between the mean and standard deviation with the shape of the normal distribution.
The total area under any density curve, including the normal distribution, must equal one or 100%.
Transcripts
Browse More Related Video


5.0 / 5 (0 votes)
Thanks for rating: