Math 14 7.1.13 Find the point estimate, margin of error & confidence interval of pop. proportion p.
TLDRThe video transcript details a statistical analysis on the vulnerability to identity theft, using a sample size of 920 with 536 respondents affirming their concern. It explains calculating the point estimate of the population proportion (0.583), determining the margin of error (0.032) at a 95% confidence level, and constructing the resulting confidence interval (0.551 to 0.615). The script concludes with the interpretation of the confidence interval, indicating 95% certainty that the true population proportion lies within the interval.
Takeaways
- 🔍 The research institute conducted a poll with a sample size of 920 respondents to gauge feelings of vulnerability to identity theft.
- 📊 Of the 920 respondents, 536 indicated they felt vulnerable, which is used as the sample statistic for further analysis.
- 🎯 The point estimate of the population proportion (p) is calculated as the number of 'yes' responses (536) divided by the total sample size (920), resulting in 0.583.
- 📝 The margin of error (E) is determined using the formula involving the critical value of Z, the point estimate, and the sample size, yielding a result of 0.032.
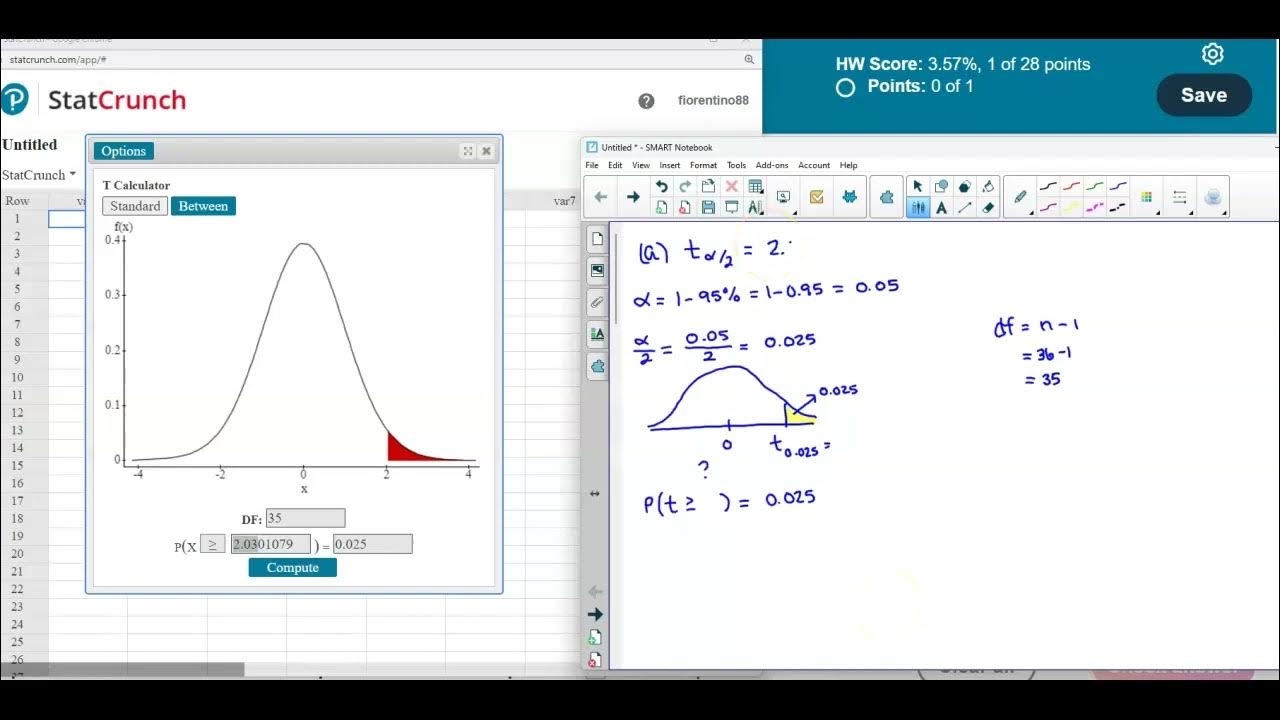
- 📚 The critical value of Z for a 95% confidence level and an area to the right of 0.025 is found to be 1.96 using statistical software.
- 📉 The complement of the point estimate (1 - p̂) is calculated to be 0.417, which is necessary for the margin of error formula.
- 📌 The confidence interval is constructed by adding and subtracting the margin of error from the point estimate, resulting in a range from 0.551 to 0.615.
- ✅ The constructed confidence interval meets the requirements for estimating a population proportion, including having at least five successes and failures.
- 🗣️ The correct interpretation of the confidence interval is that there is a 95% confidence that the true population proportion of feeling vulnerable to identity theft lies between 0.551 and 0.615.
- 📋 The script provides a step-by-step guide on calculating the point estimate, margin of error, and constructing a confidence interval for a population proportion.
Q & A
What is the sample size (n) in the research institute poll regarding vulnerability to identity theft?
-The sample size (n) in the poll is 920.
How many respondents in the poll said 'yes' to feeling vulnerable to identity theft?
-536 respondents in the poll said 'yes' to feeling vulnerable to identity theft.
What is the best point estimate of the population proportion (p) based on the poll results?
-The best point estimate of the population proportion is 0.583, which is calculated by dividing the number of 'yes' respondents (536) by the sample size (920).
What is the significance of rounding the point estimate to three decimal places?
-Rounding to three decimal places provides a precise yet manageable level of accuracy for the point estimate, making it easier to interpret and use in further calculations.
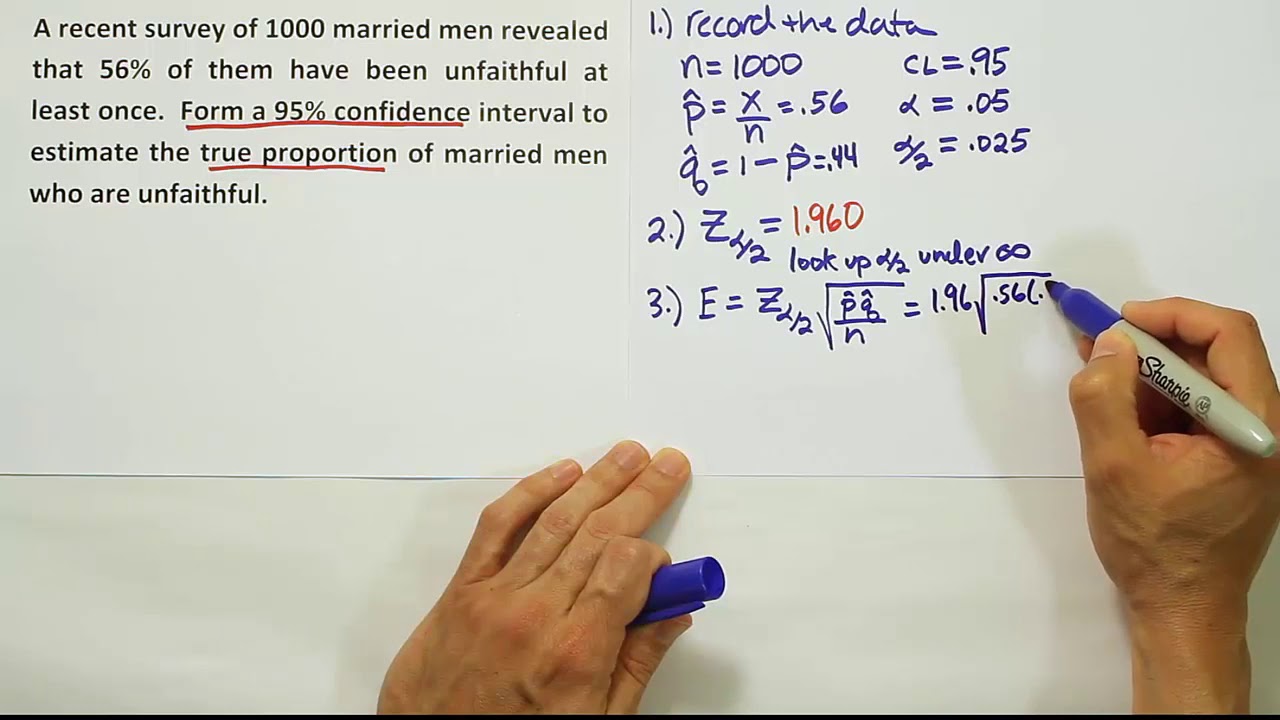
What is the formula used to calculate the margin of error (E) in this context?
-The margin of error is calculated using the formula E = Z * sqrt[(p̂ * (1 - p̂)) / n], where Z is the critical value from the Z-distribution corresponding to the desired confidence level, p̂ is the point estimate, and n is the sample size.
What is the critical value of Z for a 95% confidence level?
-The critical value of Z for a 95% confidence level is 1.96, which corresponds to the area to the right of 0.025 in a standard normal distribution.
How is the complement of the point estimate used in the margin of error formula?
-The complement of the point estimate (1 - p̂) is used in the margin of error formula to account for the variability in the sample proportion, ensuring that both the point estimate and its uncertainty are considered.
What is the calculated margin of error for the poll results?
-The calculated margin of error for the poll results is 0.032, which is derived from the formula and rounded to three decimal places for clarity.
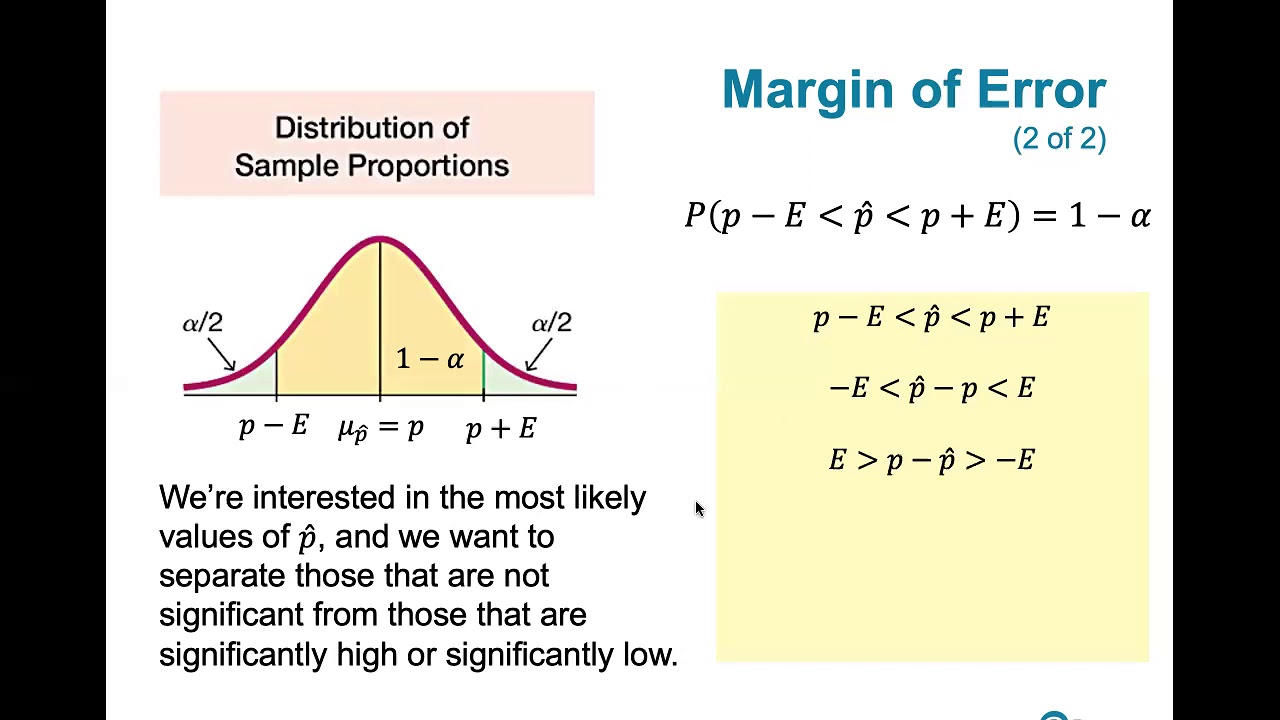
How is the confidence interval constructed based on the point estimate and margin of error?
-The confidence interval is constructed by taking the point estimate and subtracting and adding the margin of error to it, resulting in a range that likely contains the true population proportion.
What is the confidence interval for the poll results regarding vulnerability to identity theft?
-The confidence interval for the poll results is from 0.551 to 0.615, indicating that with 95% confidence, the true population proportion of people feeling vulnerable to identity theft lies within this range.
How should the confidence interval be interpreted in the context of the poll?
-The confidence interval should be interpreted as providing a range within which we are 95% confident that the true population proportion of people feeling vulnerable to identity theft falls.
Outlines
🔍 Calculating Point Estimate and Margin of Error
This paragraph explains the process of determining the point estimate for the population proportion 'p' using a sample size (n=920) and the number of affirmative responses (X=536) to a poll about vulnerability to identity theft. The point estimate is calculated as X/n and rounded to three decimal places, resulting in 0.583. Subsequently, the margin of error 'E' is found using the formula involving the critical value of Z, the square root of the point estimate, and its complement, all divided by the sample size. With a 95% confidence level, Alpha is calculated as 0.05, and the critical Z-value is determined to be 1.96 using a statistical tool. The margin of error is then computed and rounded to three decimal places, yielding 0.032.
📊 Constructing and Interpreting Confidence Interval
The second paragraph focuses on the construction of a confidence interval for the population proportion, ensuring that the conditions for a binomial distribution are met, such as having at least five successes and failures. Using the previously calculated point estimate (0.583) and margin of error (0.032), the confidence interval is established by subtracting and adding the margin of error to the point estimate, resulting in a range from 0.551 to 0.615. The paragraph concludes with an interpretation of the confidence interval, stating that there is a 95% confidence that the true population proportion lies within this interval, and correctly identifies the answer choice as B.
Mindmap
Keywords
💡Point Estimate
💡Confidence Level
💡Margin of Error
💡Critical Value of Z
💡Complement of the Point Estimate
💡Confidence Interval
💡Sample Size
💡Binomial Distribution
💡Successes and Failures
💡StatCrunch
Highlights
A research institute conducted a poll on vulnerability to identity theft with a sample size of 920 respondents.
536 respondents indicated they felt vulnerable to identity theft, representing the sample's 'yes' responses.
The best point estimate of the population proportion (p) was calculated to be 0.583.
The calculation of the point estimate involved dividing the number of 'yes' responses by the sample size and rounding to three decimal places.
A 95% confidence level was chosen for the analysis.
The margin of error (E) was determined using the formula involving the critical value of Z, point estimate, and sample size.
The critical value of Z for a 95% confidence level and an area to the right of 0.025 was found to be 1.96 using StatCrunch.
The margin of error was calculated to be 0.032, rounded to three decimal places.
The confidence interval construction requirements were checked, confirming the sample was a simple random sample with sufficient successes and failures.
The lower limit of the confidence interval was calculated as 0.551.
The upper limit of the confidence interval was determined to be 0.615.
The confidence interval indicates that there is a 95% confidence that the true population proportion lies between 0.551 and 0.615.
The interpretation of the confidence interval was correctly stated, indicating the range within which the true population proportion is likely to fall.
The correct answer for the interpretation of the confidence interval was identified as option B.
The process of determining the margin of error and confidence interval followed standard statistical methods for estimating population proportions.
The use of StatCrunch software facilitated the finding of the critical Z value for the given confidence level.
The importance of checking the conditions for constructing a confidence interval was emphasized to ensure the validity of the results.
Transcripts
Browse More Related Video
How to construct a confidence interval for the proportion, an example

Confidence Interval for a population proportion | Solved Problems
Math 14 HW 7.2.5-T Find critical t value, margin of error & confidence interval for population mean.
Finding the best point estimate and confidence interval for proportions
7.1.4 Estimating a Population Proportion - Margin of Error and Computing Confidence Intervals

Confidence interval example | Inferential statistics | Probability and Statistics | Khan Academy
5.0 / 5 (0 votes)
Thanks for rating: