Math 14 HW 7.2.5-T Find critical t value, margin of error & confidence interval for population mean.
TLDRThis video script provides a detailed walkthrough of calculating a 95% confidence interval for the mean weight of newborn girls based on a sample of 36. It explains determining the critical T value using a T-distribution, calculating the margin of error, and ensuring the sample meets the criteria for constructing a confidence interval. The script concludes with the formula for the confidence interval and an interpretation of its meaning, emphasizing the 95% confidence that the interval contains the true population mean weight.
Takeaways
- 📊 The script discusses a statistical analysis involving the weights of newborn girls, with a sample size of 36.
- 🔢 The sample mean weight is reported as 3216.7 grams, with a standard deviation of 688.5 grams.
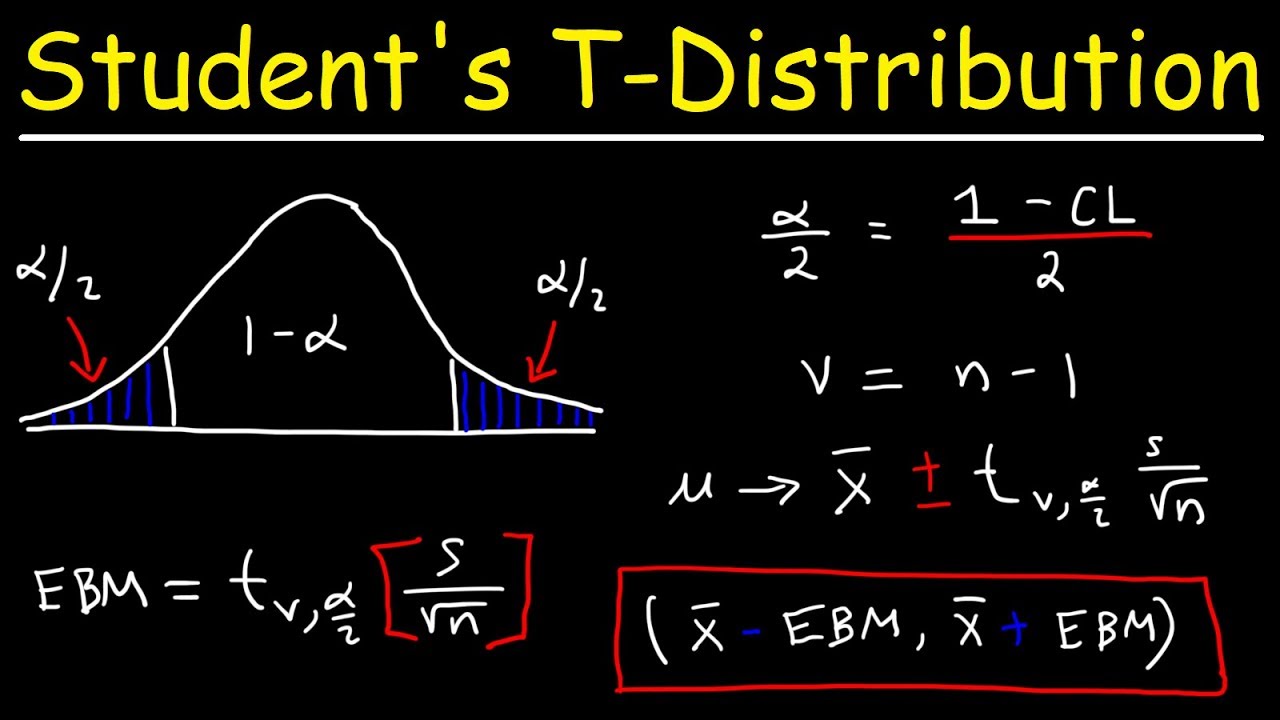
- 📉 A 95% confidence level is used to determine the critical T value for the margin of error.
- 📍 The critical T value is calculated to be 2.03 using a T-distribution with 35 degrees of freedom.
- 🧐 The margin of error is derived using the formula: critical T value * sample standard deviation / √n, resulting in 232.9 grams.
- 📐 The script verifies that the requirements for constructing a confidence interval are met, as the sample size is greater than 30.
- 📈 The confidence interval for the population mean is calculated to be between 2983.8 grams and 3449.6 grams.
- 📝 The script emphasizes the importance of understanding the confidence interval as a range that likely contains the true population mean.
- 🤔 It is noted that the confidence level represents the success rate of the procedure used to construct the confidence interval.
- 📚 The script provides a step-by-step guide on how to calculate the critical T value, margin of error, and confidence interval.
- 🔍 The use of StatCrunch software is mentioned for finding the critical T value and completing the statistical analysis.
Q & A
What is the sample size (n) for the weights of newborn girls in the study?
-The sample size is 36.
What is the sample mean weight (X bar) of the newborn girls?
-The sample mean weight is 3216.7 grams.
What is the sample standard deviation for the weights of the newborn girls?
-The sample standard deviation is 688.5 grams.
What confidence level is used in the study?
-A 95% confidence level is used.
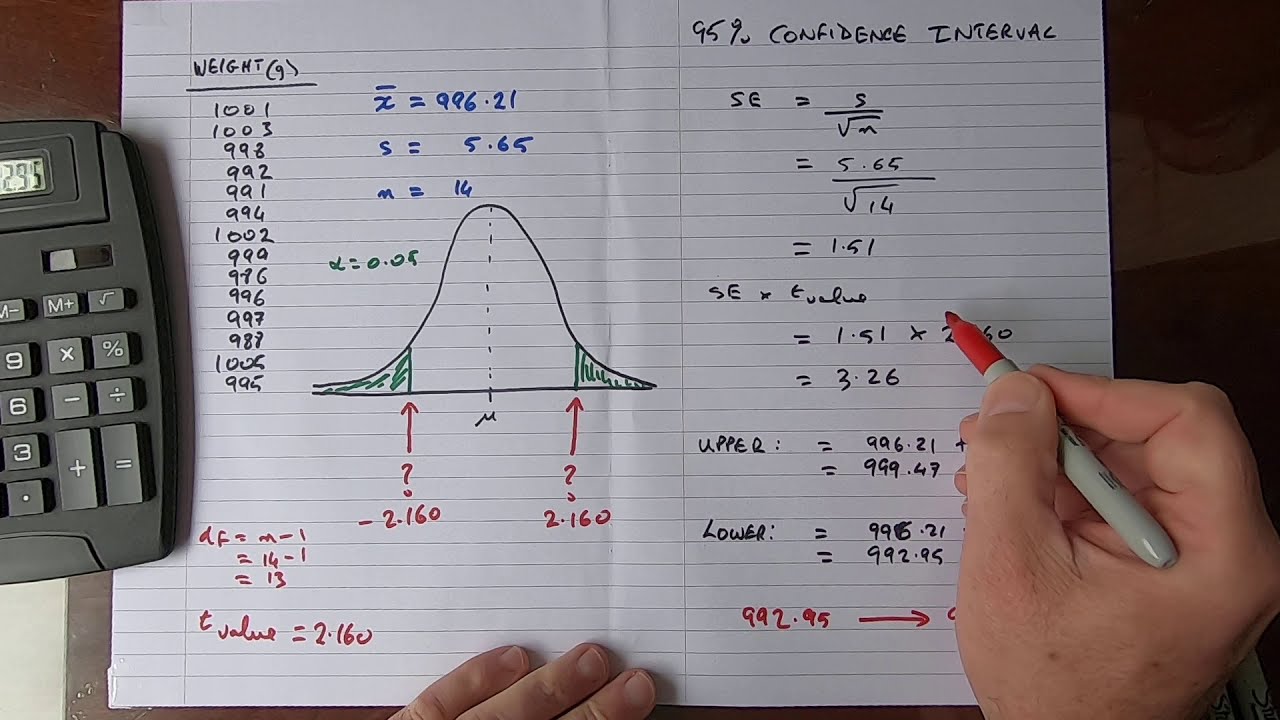
How is the critical T value determined for the margin of error?
-The critical T value is found using the degrees of freedom, which is the sample size minus one (35 in this case), and the area in the right tail of the T distribution corresponding to the confidence level (0.025 for 95% confidence).
What is the critical T value obtained from the T distribution table?
-The critical T value is 2.03.
How is the margin of error calculated in this study?
-The margin of error is calculated as the critical T value (2.03) times the sample standard deviation (688.5) divided by the square root of the sample size (6).
What is the calculated margin of error for the weights of the newborn girls?
-The margin of error is 232.9 grams.
What are the requirements for constructing a confidence interval to estimate a population mean?
-The requirements are that the sample is a simple random sample and either the population is normally distributed or the sample size is greater than 30.
What is the lower limit of the 95% confidence interval for the mean weight of newborn girls?
-The lower limit is 2983.8 grams.
What is the upper limit of the 95% confidence interval for the mean weight of newborn girls?
-The upper limit is 3449.6 grams.
How should the confidence interval be interpreted?
-The confidence interval can be interpreted as having a 95% confidence that the interval from the lower bound to the upper bound contains the true value of the population mean weight of newborn girls.
Outlines
📊 Calculating the Critical T Value for Confidence Intervals
This paragraph explains the process of determining the critical T value for a 95% confidence interval using a sample of 36 newborn girls' weights with a mean of 3216.7 grams and a standard deviation of 688.5 grams. The critical T value is calculated by finding the area in the right tail of the T distribution corresponding to the given confidence level, which is 0.025 after dividing the alpha value (0.05) by two. The degrees of freedom are determined by subtracting 1 from the sample size, resulting in 35. Using a statistical software, the critical T value is found to be 2.03 after rounding to two decimal places.
🔍 Finding the Margin of Error and Confidence Interval for Newborn Weights
The second paragraph details the calculation of the margin of error and the confidence interval for the population mean of newborn girls' weights. The margin of error is determined by multiplying the critical T value (2.03) by the sample standard deviation (688.5 grams) and then dividing by the square root of the sample size (36), resulting in a margin of error of 232.9 grams when rounded to one decimal place. The confidence interval is then calculated by adding and subtracting this margin of error from the sample mean, yielding a lower limit of 2983.8 grams and an upper limit of 3449.6 grams. The paragraph concludes with an interpretation of the confidence interval, stating that there is a 95% confidence that the interval contains the true population mean weight of newborn girls.
Mindmap
Keywords
💡Summary Statistics
💡Sample Size (n)
💡Sample Mean (X bar)
💡Sample Standard Deviation
💡Confidence Level
💡Critical T Value
💡Margin of Error
💡Degrees of Freedom
💡Confidence Interval
💡Normal Distribution
💡Interpretation of Confidence Interval
Highlights
The sample size for the newborn girls' weights is 36.
The sample mean weight is 3216.7 grams.
The sample standard deviation is 688.5 grams.
A 95% confidence level is used for the analysis.
The critical T value for the margin of error is determined to be 2.03.
The degrees of freedom are calculated as 35.
The margin of error is calculated using the critical T value, sample standard deviation, and sample size.
The margin of error is found to be 232.9 grams.
The requirements for constructing a confidence interval are satisfied with a sample size greater than 30.
The confidence interval for the population mean weight is calculated.
The lower limit of the confidence interval is 2983.8 grams.
The upper limit of the confidence interval is 3449.6 grams.
The confidence interval estimate implies a 95% success rate in capturing the true population mean.
The interpretation of the confidence interval is explained in the context of the population mean weight of newborn girls.
The process involves using StatCrunch for calculating the critical T value and margin of error.
The importance of checking the requirements before constructing a confidence interval is emphasized.
The practical application of the confidence interval is in estimating the mean weight of newborn girls with a high degree of confidence.
Transcripts
Browse More Related Video

Math 14 7.1.13 Find the point estimate, margin of error & confidence interval of pop. proportion p.
How To...Calculate the Confidence Interval for a Sample

Confidence Interval for a population mean - t distribution
Student's T Distribution - Confidence Intervals & Margin of Error

Math 14 HW 7.2.2 Find the degrees of freedom and critical t value.
Deriving a Confidence Interval for the Mean (The Rationale Behind the Confidence Interval Formula)
5.0 / 5 (0 votes)
Thanks for rating: