How to construct a confidence interval for the proportion, an example
TLDRThe video script details a statistical analysis of a survey involving a thousand married men, where 56% admitted to being unfaithful at least once. The presenter guides viewers through constructing a 95% confidence interval for the true proportion of unfaithful married men. Key steps include identifying the sample size (n=1000), calculating the sample proportion (p̂=0.56), determining q̂ (1-p̂), and using a Z-table to find the Z value for a 95% confidence level (Z=1.96). The margin of error is calculated using the formula Z * sqrt(p̂*q̂/n), resulting in approximately 0.0307. The final confidence interval is estimated to be between 52.9% and 59.1%, suggesting that a majority of married men have been unfaithful, with this interval reflecting the survey's findings.
Takeaways
- 🔍 The script discusses a statistical problem of estimating the true proportion of married men who have been unfaithful, using a 95% confidence interval.
- 📊 The data comes from a survey of a thousand married men, where 56% reported being unfaithful at least once.
- 📝 The process involves four steps: recording data, determining the sample size (N=1000), calculating the sample proportion (P-hat=0.56), and finding Q-hat (1-P-hat=0.44).
- 📉 The confidence level is set at 95%, which means the alpha (α) value is 5%, and α/2 is 0.025.
- 📚 To find the Z-score for the confidence interval, the script uses the Z table for a large sample size, looking up 0.025 under the infinity row to get Z=1.96.
- 🧐 The margin of error is calculated using the formula Z * sqrt(P-hat * Q-hat / N), which results in approximately 0.0307.
- 📌 Subtracting and adding the margin of error to the sample proportion (P-hat) gives the confidence interval limits: 0.5307 and 0.5691.
- 📈 The final confidence interval is estimated to be between 52.9% and 59.1%, suggesting that a majority of married men have been unfaithful at least once.
- 📝 The script emphasizes that the confidence interval provides a range within which we can be 95% confident that the true proportion lies.
- 🤔 The problem highlights the importance of statistical analysis in interpreting survey data and making inferences about a population.
Q & A
What is the purpose of the survey mentioned in the script?
-The purpose of the survey is to determine the proportion of married men who have been unfaithful at least once.
What is the sample size (N) used in the survey?
-The sample size used in the survey is 1,000 married men.
What is the sample proportion (P hat) of married men who have been unfaithful?
-The sample proportion (P hat) is 0.56, which represents 56% of the surveyed married men.
How is the sample proportion (P hat) calculated?
-The sample proportion (P hat) is calculated as the number of married men who have been unfaithful (560) divided by the total number of surveyed men (1,000), resulting in 0.56.
What is Q hat in the context of this survey?
-Q hat is calculated as 1 minus P hat, which represents the proportion of married men who have not been unfaithful. In this case, Q hat is 0.44.
What is the confidence level used for the survey?
-The confidence level used for the survey is 95%.
What is alpha and how is it derived from the confidence level?
-Alpha is the significance level used in statistical tests. It is derived from the complement of the confidence level. For a 95% confidence level, alpha is 5% (or 0.05).
What is the Z value used for a 95% confidence interval with a large sample size?
-The Z value used for a 95% confidence interval with a large sample size is 1.96, which corresponds to the Z value for alpha/2 (0.025) in a standard normal distribution table.
How is the margin of error calculated for a proportion?
-The margin of error for a proportion is calculated using the formula Z * sqrt((P hat * Q hat) / N), where Z is the Z value from the standard normal distribution table, P hat is the sample proportion, Q hat is 1 - P hat, and N is the sample size.
What is the resulting confidence interval for the true proportion of unfaithful married men?
-The resulting 95% confidence interval for the true proportion of unfaithful married men is between 52.9% and 59.1%.
What does the confidence interval suggest about the majority of married men in the survey?
-The confidence interval suggests that a majority of married men in the survey have been unfaithful at least once, as the lower limit of the interval is above 50%.
Outlines
📊 Estimating Unfaithful Proportion with Confidence Interval
The video script begins by presenting a statistical problem based on a survey of a thousand married men, revealing that 56% have been unfaithful at least once. The task is to form a 95% confidence interval to estimate the true proportion of unfaithful married men. The approach involves a four-step procedure similar to that used for estimating means, but tailored for proportions. Key elements identified include the sample size (N=1000), the sample proportion of unfaithful men (P hat = 0.56), and the complementary proportion (Q hat = 1 - P hat = 0.44). The confidence level is set at 95%, which translates to an alpha value of 0.05, and subsequently, alpha/2 = 0.025. The next step involves obtaining a Z-score from the Z-table for the given alpha/2 at an infinite sample size, which is found to be 1.96. This Z-score is crucial for calculating the margin of error in the subsequent steps.
🔢 Calculating the Margin of Error and Confidence Interval
Continuing from the previous paragraph, the script explains the calculation of the margin of error using the Z-score obtained (1.96), the square root of the product of P hat and Q hat (√(0.56 * 0.44)), and the sample size (N=1000). The margin of error is calculated as 1.96 * √(0.56 * 0.44) / 1000, resulting in a value of approximately 0.03067. This value is then used to determine the confidence interval by adding and subtracting it from the sample proportion (P hat = 0.56). The resulting interval is from 0.53067 to 0.5891, which translates to 52.97% to 59.09% when expressed as percentages. The script concludes by stating that we are 95% confident that the true proportion of married men who are unfaithful lies within this interval. This interval suggests that a majority of married men have been unfaithful at least once, as even the lower bound of the interval is above 50%.
Mindmap
Keywords
💡Confidence Interval
💡Proportion
💡Sample Proportion (P hat)
💡Q hat
💡Margin of Error
💡Z Value
💡Sample Size (N)
💡Alpha (α)
💡Point Estimator
💡Unfaithful
Highlights
A recent survey reveals that 56% of married men have been unfaithful at least once.
The task is to form a 95% confidence interval to estimate the true proportion of unfaithful married men.
The problem involves creating a confidence interval for a proportion, not for a mean.
The four-step procedure for creating a confidence interval is outlined.
The sample size (N) is identified as 1,000 married men surveyed.
The sample proportion (P-hat) is given as 56% or 0.56.
Q-hat is calculated as 1 minus P-hat, resulting in 0.44.
A 95% confidence level is specified, with alpha being 5%.
Alpha divided by 2 is calculated to be 0.025 for the Z-table lookup.
The Z value for a 95% confidence interval is found to be 1.96.
The margin of error formula for a proportion is introduced.
The margin of error is calculated using the Z value, P-hat, Q-hat, and N.
The calculated margin of error is approximately 0.0307.
The confidence interval is constructed by adding and subtracting the margin of error from P-hat.
The resulting 95% confidence interval is from 0.529 to 0.591.
The interpretation of the interval suggests that a majority of married men have been unfaithful.
Transcripts
Browse More Related Video

Confidence Interval for a population proportion | Solved Problems
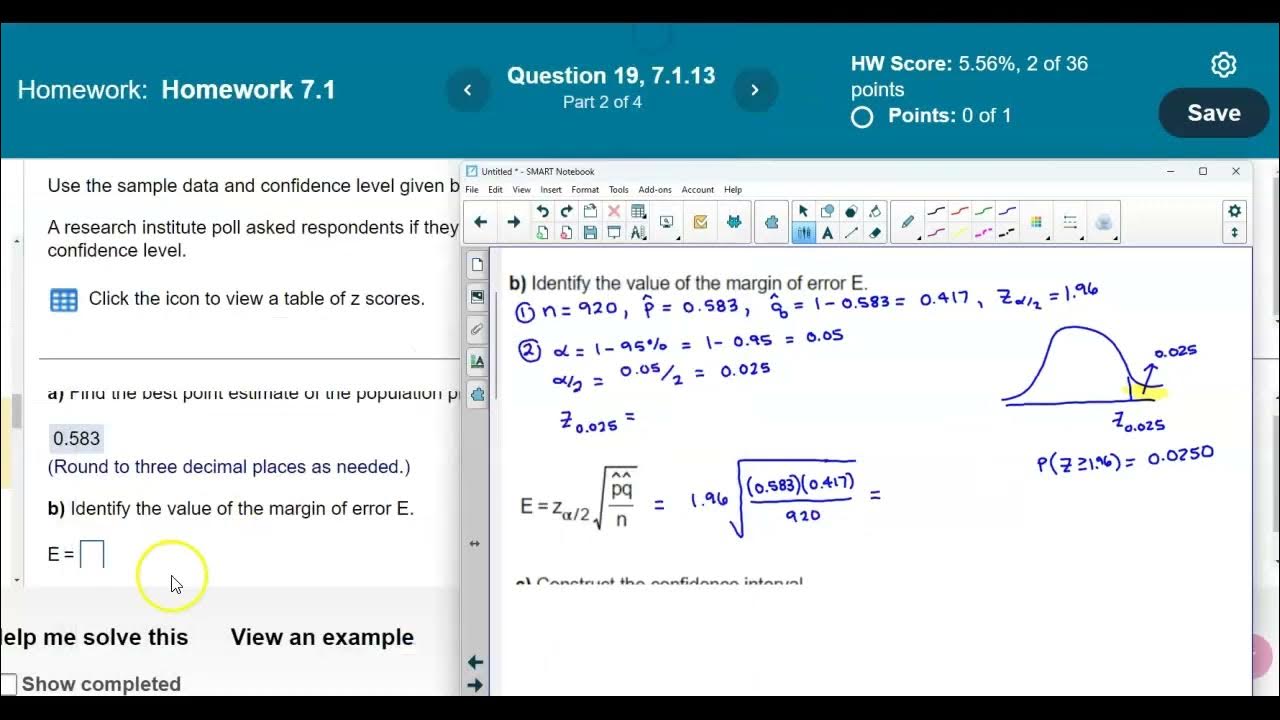
Math 14 7.1.13 Find the point estimate, margin of error & confidence interval of pop. proportion p.

Confidence Intervals for Population Proportions

Confidence interval example | Inferential statistics | Probability and Statistics | Khan Academy
Critical value (z*) for a given confidence level | AP Statistics | Khan Academy

Example constructing and interpreting a confidence interval for p | AP Statistics | Khan Academy
5.0 / 5 (0 votes)
Thanks for rating: