7.2.1 Estimating a Population Mean - Student t Distribution and Finding Critical t Values
TLDRThis video lesson introduces the Student's t-distribution, essential for estimating a population mean when the population standard deviation is unknown. It explains the characteristics of the t-distribution, its relation to the normal distribution, and how it varies with sample size. The instructor demonstrates how to calculate the margin of error and find the critical t-value for a given confidence level, using both Excel functions and a table lookup, setting the stage for constructing confidence intervals in subsequent lessons.
Takeaways
- 📚 The video's main goal is to teach the characteristics of the Student's t-distribution and how to find a critical t-value for a given confidence level.
- 🔍 Lesson 7.2 focuses on using sample data to make inferences about a population mean, including point estimation and confidence intervals, especially when the population standard deviation is unknown.
- 📉 The Student's t-distribution is introduced as a new distribution needed for computing confidence intervals when the population standard deviation is unknown, differing from the normal distribution.
- 🎓 The term 'Student's t-distribution' originated from William Sealy Gosset, who published under the pseudonym 'Student' due to his employer's restrictions on publishing research.
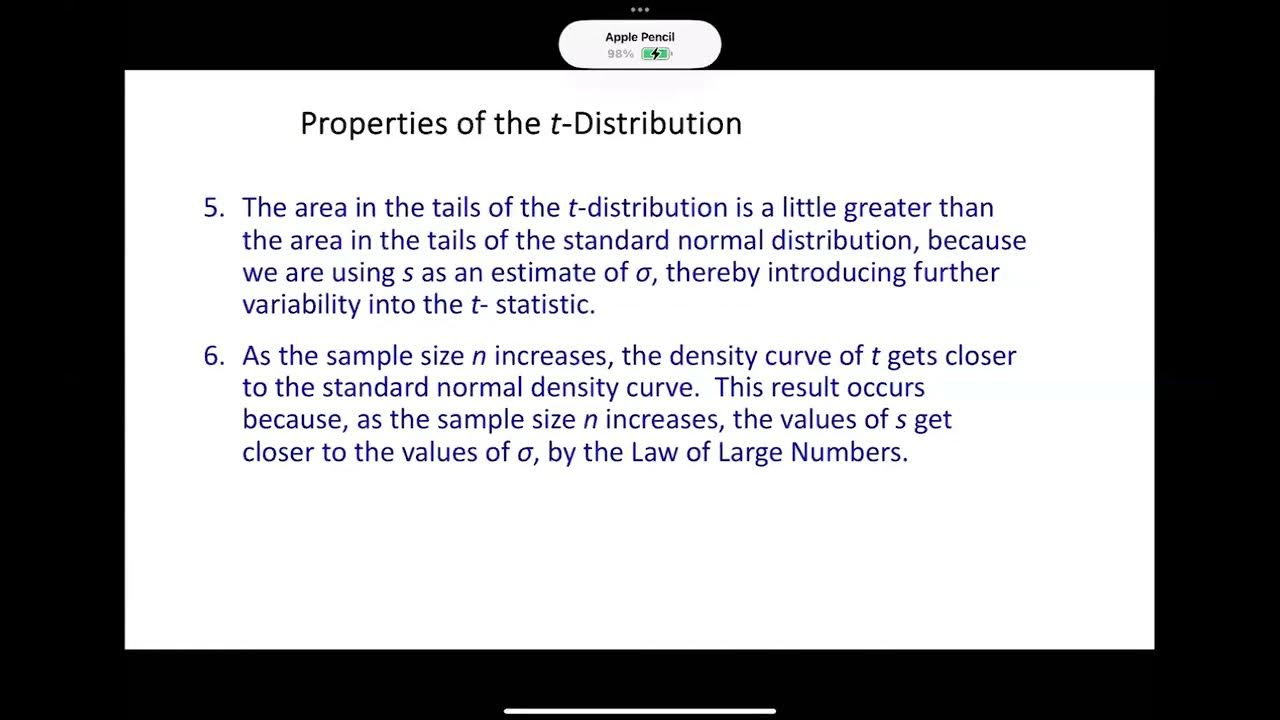
- 📈 The shape of the Student's t-distribution varies with different sample sizes, being more spread out (having a larger standard deviation) with smaller sample sizes and approaching the normal distribution as sample size increases.
- 📊 The mean of the Student's t-distribution is zero, and it is symmetric with a bell shape, but it has more variability (higher standard deviation) compared to the standard normal distribution.
- 🔢 Degrees of freedom, represented as 'df', is a key concept introduced, defined as the number of sample values that can vary after restrictions are imposed, typically calculated as the sample size minus one (n-1).
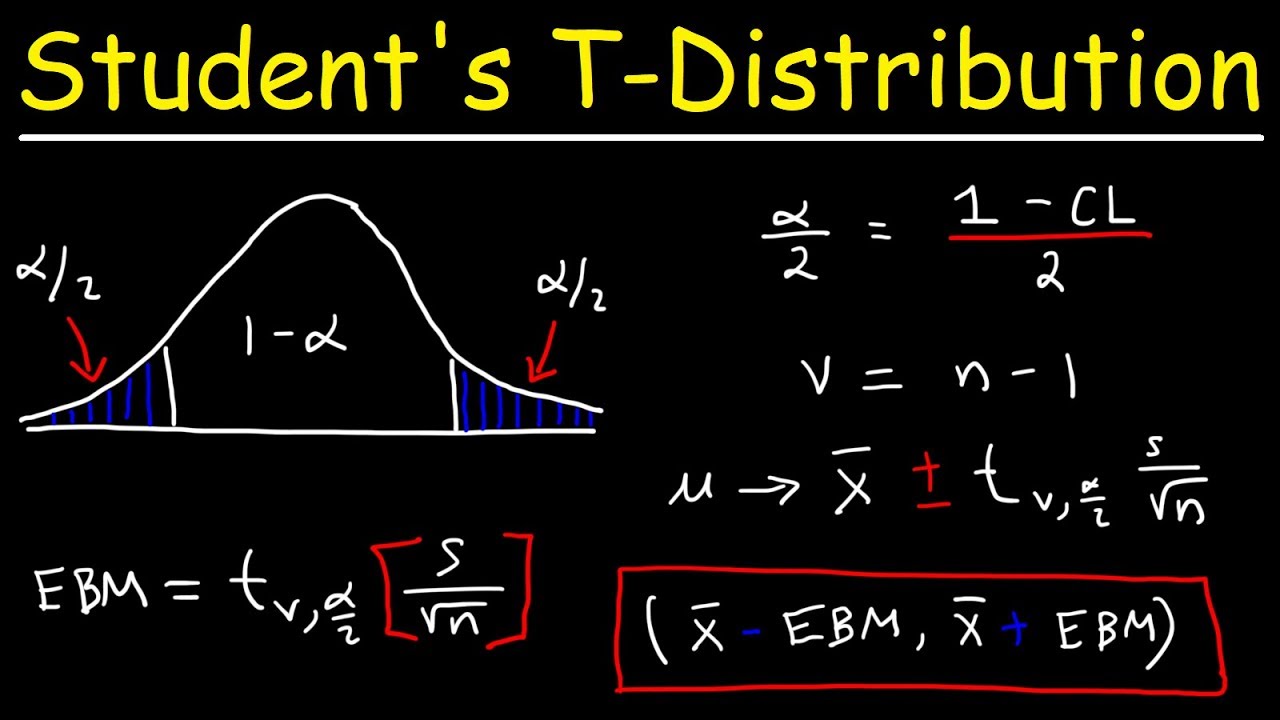
- 📝 The formula for the margin of error in the confidence interval for a population mean uses the critical t-value (t_sub_alpha/2) multiplied by the sample standard deviation divided by the square root of the sample size.
- 🔍 To find the critical t-value, one must know the sample size to determine the degrees of freedom and the desired confidence level to find the corresponding t-value from a t-distribution table or using statistical software.
- 📋 The video provides a method to find the critical t-value using Excel's T.INV function, which requires the probability (alpha level in decimal form) and the degrees of freedom as inputs.
- 📘 Additionally, the video mentions Table A3, a statistical table provided in the course materials, which can be used to find the critical t-value for different degrees of freedom and areas in two tails.
Q & A
What is the main goal of the video?
-The main goal of the video is to teach the characteristics of the Student t-distribution and how to find a critical value t (subscript alpha over 2) corresponding to a given confidence level, which is part of learning outcome number one of lesson 7.2.
What is the purpose of learning about the Student t-distribution in statistics?
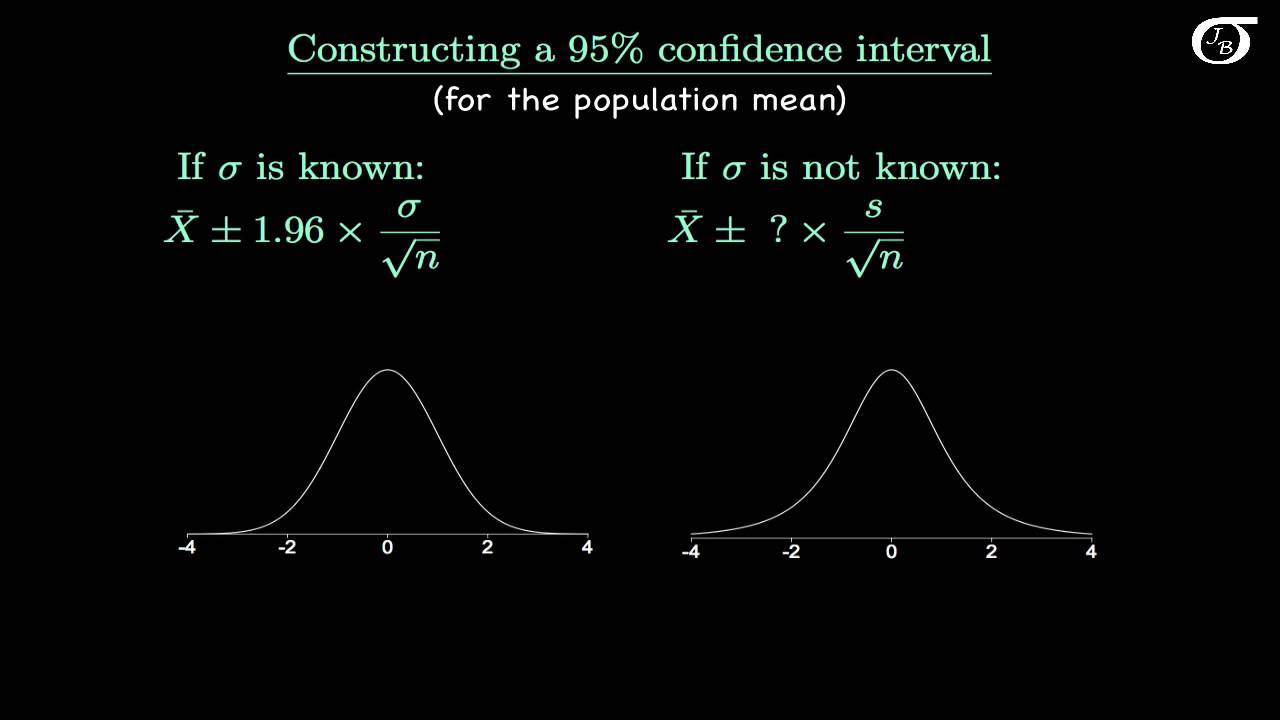
-The purpose of learning about the Student t-distribution is to compute confidence intervals for the population mean when the population standard deviation is unknown, which is often the case in real-world scenarios.
What is the historical context behind the development of the Student t-distribution?
-The Student t-distribution was developed by William Sealy Gosset, a Guinness Brewery employee, who needed a distribution that could be used with small sample sizes. He published his findings under the pseudonym 'Student' due to the brewery's policy against employees publishing research.
How does the shape of the Student t-distribution compare to the standard normal distribution?
-The Student t-distribution has the same general symmetric, bell shape as the standard normal distribution but with more variability, indicated by a standard deviation greater than one. As the sample size increases, the Student t-distribution approaches the shape of the standard normal distribution.
What is meant by 'degrees of freedom' in the context of the Student t-distribution?
-In the context of the Student t-distribution, 'degrees of freedom' refers to the number of independent values in the data set that can vary freely. For constructing confidence intervals for population means, the degrees of freedom are calculated as the sample size minus one (n - 1).
How are critical t-values used in calculating confidence intervals for the population mean?
-Critical t-values are used in the formula for the margin of error in the calculation of confidence intervals for the population mean. The margin of error is given by the critical t-value multiplied by the sample standard deviation divided by the square root of the sample size.
What is the formula for the margin of error when the population standard deviation is unknown?
-The formula for the margin of error when the population standard deviation is unknown is given by t (subscript alpha over 2) times the sample standard deviation divided by the square root of the sample size.
How does the video demonstrate the relationship between the sample size and the shape of the Student t-distribution?
-The video uses an interactive Desmos graph to show how the shape of the Student t-distribution changes with different sample sizes, illustrating that as the sample size increases, the distribution becomes less variable and more closely resembles the standard normal distribution.
What is the difference between the critical values of t and z in the context of confidence intervals?
-The critical values of t and z differ because they come from different distributions. The t critical values are used with the Student t-distribution and depend on the sample size, while the z critical values are used with the standard normal distribution and do not depend on the sample size.
How can one find the critical t-value corresponding to a specific confidence level and sample size?
-One can find the critical t-value corresponding to a specific confidence level and sample size using either a t-distribution table or an Excel function like T.INV, which calculates the t-value for a given area in two tails and degrees of freedom.
Outlines
📚 Introduction to Student's t-Distribution and Confidence Intervals
This paragraph introduces the concept of learning outcomes in statistics, specifically focusing on the student t-distribution and its role in estimating population means when the population standard deviation is unknown. The video aims to teach viewers about the characteristics of the student t-distribution, how to find critical values, and the importance of understanding degrees of freedom. It also provides a historical background on the development of the student t-distribution by William Sealy Gosset, an employee at Guinness Brewery, who published his findings under the pseudonym 'Student'. The paragraph sets the stage for the discussion on confidence intervals and the formulas involved in their calculation.
📉 Key Features and Comparison of Student's t-Distribution
The paragraph delves into the key features of the student t-distribution, highlighting its similarity to the standard normal distribution but with greater variability, especially in small samples. It explains that the t-distribution's shape and standard deviation change with different sample sizes, becoming more like the normal distribution as the sample size increases. The paragraph also discusses the relationship between the student t-distribution and the standard normal distribution through an interactive graph, illustrating how the t-distribution's standard deviation is greater than one and decreases as the sample size grows.
🔍 Critical Values and the Role of Sample Size in t-Distribution
This section discusses the importance of critical values in the context of the student t-distribution, particularly for constructing confidence intervals. It explains that the t-distribution varies with sample size, and thus, the critical t values differ from those of the standard normal distribution. The paragraph provides an example of how to find the critical t value for a given confidence level and sample size, emphasizing the need to understand degrees of freedom, which is calculated as the sample size minus one. It also uses an interactive graph to demonstrate how the t-distribution's shape changes with increasing sample size.
📝 Degrees of Freedom and Finding Critical t Values
The paragraph explains the concept of degrees of freedom in the context of the student t-distribution, which is crucial for finding the critical t values necessary for constructing confidence intervals. It describes degrees of freedom as the number of sample values that can vary after restrictions are imposed, typically calculated as the sample size minus one. The paragraph also outlines the process of finding the critical t value for a given confidence level and sample size, using both Excel functions and a table of critical t values, to ensure the correct t-distribution is chosen for the analysis.
📊 Demonstrating the Calculation of Critical t Values
This paragraph provides a step-by-step demonstration of calculating the critical t value using Excel and a table of critical values. It emphasizes the importance of identifying the correct degrees of freedom and the area in two tails corresponding to the desired confidence level. The paragraph illustrates the process of using the T.INV function in Excel to find the critical t value and compares it with the value obtained from the table, showing that both methods yield the same result, which is essential for constructing accurate confidence intervals.
🛠️ Applying Critical t Values in Confidence Interval Construction
The final paragraph summarizes the process of applying the critical t values in the construction of confidence intervals for population means when the population standard deviation is unknown. It reiterates the importance of the critical t value in defining the margin of error within the confidence interval formula. The paragraph concludes by reinforcing the readiness of the viewer to proceed to the next lesson, where they will learn to construct confidence intervals using the concepts and methods introduced in the video.
Mindmap
Keywords
💡Student t-distribution
💡Confidence Interval
💡Margin of Error
💡Degrees of Freedom
💡Critical Value
💡Sample Size (n)
💡Population Mean (μ)
💡Sample Mean (x̄)
💡Sample Standard Deviation (s)
💡William Sealy Gosset
Highlights
The video aims to teach the characteristics of the Student's t-distribution and how to find a critical value t for a given confidence level.
Lesson 7.2 focuses on using sample data to make inferences about a population mean through point estimates and confidence intervals.
A new distribution, the Student t-distribution, is introduced for computing confidence intervals when the population standard deviation is unknown.
The Student t-distribution is named after William Sealy Gosset, who published under the pseudonym 'Student' due to workplace restrictions.
The distribution's shape varies with different sample sizes, being more spread out with smaller samples, indicating greater variability.
The Student t-distribution approaches the standard normal distribution as the sample size increases.
The mean of the Student t-distribution is zero, with a standard deviation greater than one, reflecting increased variability in smaller samples.
The concept of 'degrees of freedom' is introduced, defined as the number of sample values that can vary after restrictions are imposed.
For confidence interval problems, the degrees of freedom are calculated as the sample size minus one.
Critical t-values are found using the t.inv function in Excel or by referencing a t-distribution table.
The critical t-value for a 95% confidence interval with a sample size of 18 is approximately 2.110.
The video provides a method to sketch a distribution to visualize the area corresponding to a given confidence level.
The video demonstrates the use of an interactive graph to compare the Student t-distribution with the standard normal distribution.
The video explains the importance of the critical t-value in defining the margin of error for confidence intervals.
The video concludes with a practical application of finding the critical t-value for a given sample size and confidence level.
The video provides a historical context for the development of the Student t-distribution and its relevance in statistical analysis.
The video emphasizes the practicality of understanding the Student t-distribution in constructing confidence intervals for population means.
Transcripts
Browse More Related Video
7.2.0 Estimating a Population Mean - Lesson Overview, Key Concepts, Learning Outcomes
Student's T Distribution - Confidence Intervals & Margin of Error
Introduction to the t Distribution (non-technical)

Elementary Statistics - Chapter 7 - Estimating Parameters and Determining Sample Sizes Part 2

Elementary Stats Lesson #16
STAT243Z 02/29/24 Zoom Recording
5.0 / 5 (0 votes)
Thanks for rating: