7.2.5 Estimating a Population Mean - Confidence Intervals with Known Pop. Standard Deviation
TLDRThis video script offers a detailed explanation of calculating a confidence interval for the population mean when the population standard deviation is known. It covers the conditions required for using the normal distribution approximation, such as a normally distributed population or a sample size greater than 30. The script provides a step-by-step example using a dataset of baby boys' birth weights, illustrating how to find the critical z-score for a 99% confidence level, compute the margin of error, and establish the confidence interval. It also clarifies when to use z-scores versus t-scores in statistical analysis.
Takeaways
- 📚 The video discusses learning outcome number five of lesson 7.2, focusing on finding and interpreting a confidence interval for the population mean when the population standard deviation is known.
- 📉 To compute the confidence interval, it's necessary that the sampling distribution of the sample means is approximately normal, which can be assumed if the population is normally distributed or if the sample size is greater than 30.
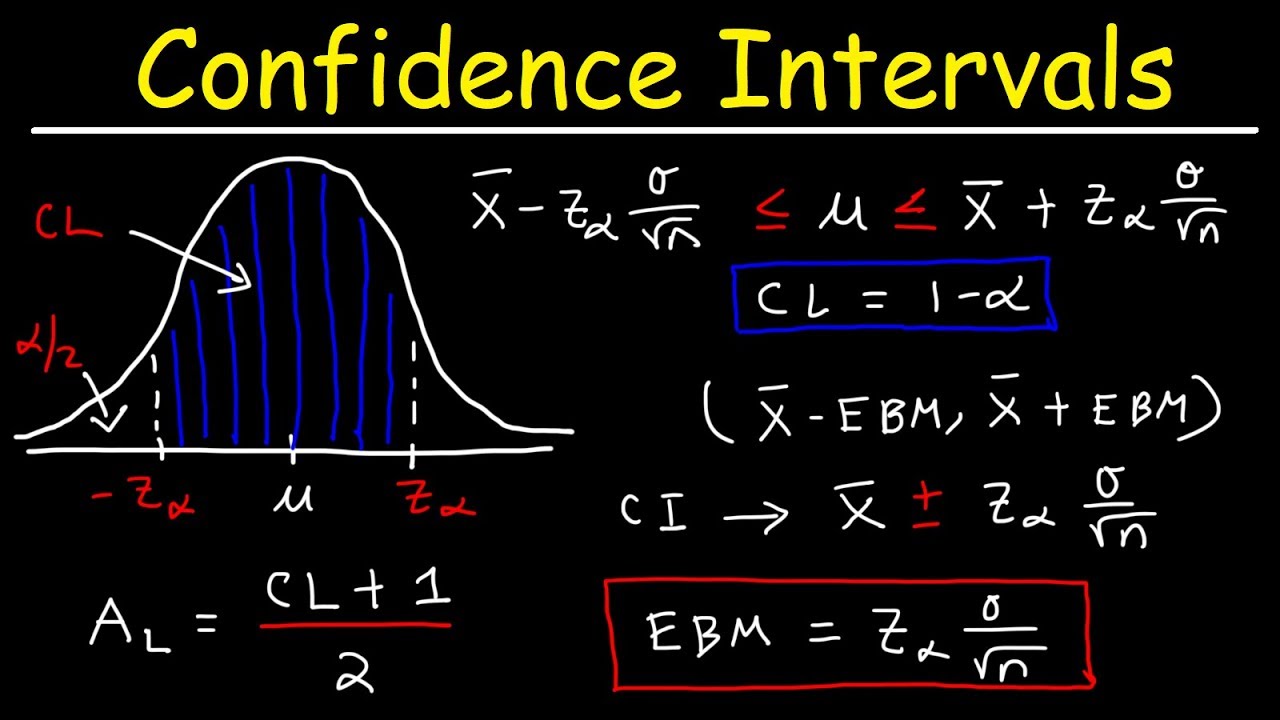
- 🔢 The formula for the confidence interval when the population standard deviation is known involves the sample mean, the critical z-score, the population standard deviation, and the square root of the sample size.
- 👶 An example is provided using the birth weights of 195 baby boys, with a sample mean of 32.7 hectograms and a known population standard deviation of 6.6 hectograms.
- 📉 The confidence interval is calculated as the sample mean plus or minus the margin of error, which is derived from the critical z-score.
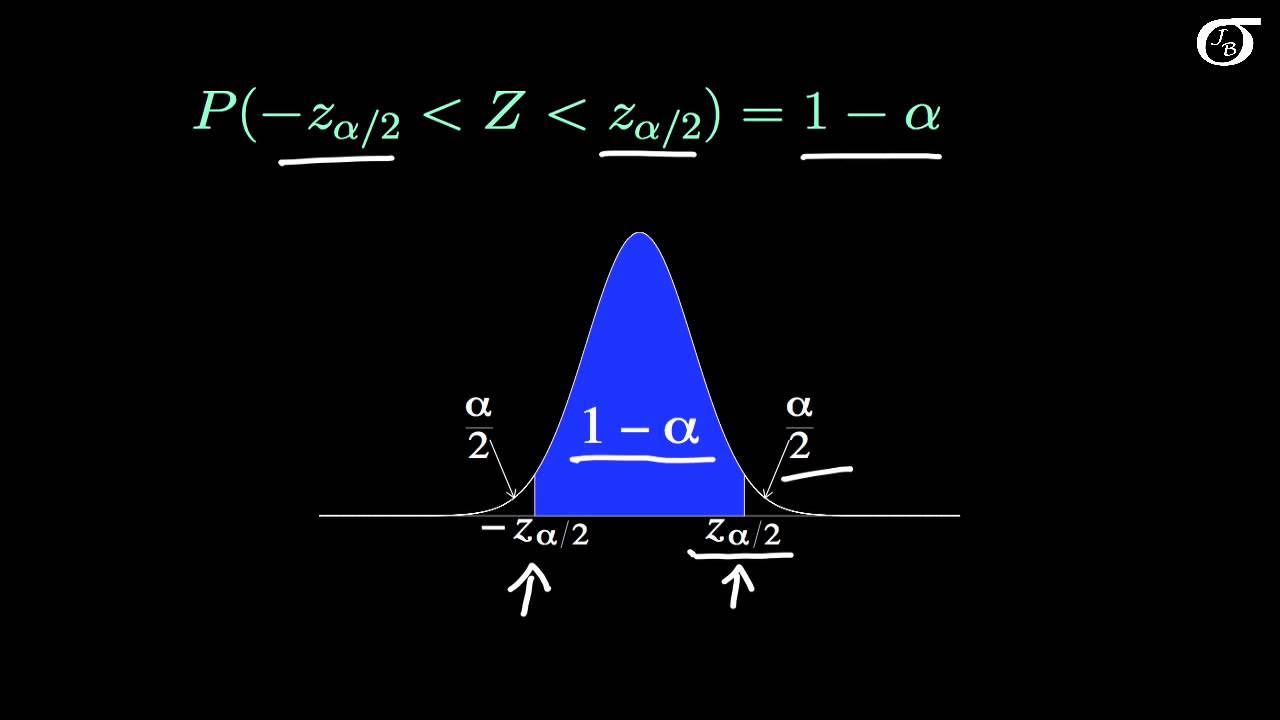
- 🔑 The critical z-score for a 99% confidence level is determined to be 2.575 by using a standard normal distribution table or statistical software.
- 🧮 The margin of error is calculated by multiplying the critical z-score by the population standard deviation and dividing by the square root of the sample size.
- 📝 The resulting confidence interval provides an estimated range within which the true population mean is believed to lie with a certain level of confidence.
- 🤔 The choice between using z-scores or t-scores for constructing confidence intervals depends on whether the population standard deviation is known and whether the sample size meets the normal distribution criteria.
- 🚫 If the population is not normally distributed and the sample size is small, alternative methods such as bootstrapping or non-parametric methods should be considered, although these are not covered in the class.
- 💯 The interpretation of the confidence interval is that if the intervals were constructed for all possible samples of the same size, the true population mean would fall within 99% of these intervals.
Q & A
What is the main topic of this video?
-The main topic of this video is learning about finding and interpreting a confidence interval for the population mean when the population standard deviation is known.
What are the conditions under which the formulas for the confidence interval of the population mean are applicable?
-The conditions are that the sampling distribution of the sample means needs to be approximately normal, which can be assumed if the original population is normally distributed or if the sample size is greater than 30.
What is the formula for the margin of error when the population standard deviation is known?
-The margin of error is calculated as the critical z-score (z_sub_alpha/2) multiplied by the population standard deviation and then divided by the square root of the sample size (n).
What is the difference between using z-scores and t-scores in constructing a confidence interval?
-Z-scores are used when the population standard deviation is known and the sample size is large (greater than 30) or the original population is normally distributed. T-scores are used when the population standard deviation is not known and the sample means are normally distributed or can be approximated by a normal distribution.
How is the critical z-value determined for a 99% confidence level?
-The critical z-value for a 99% confidence level is found by looking up the z-value that corresponds to the area of 0.995 in a standard normal distribution table or using statistical software to find the inverse of the normal distribution function.
What is the sample mean and population standard deviation given in the example about baby boys' birth weights?
-The sample mean is 32.7 hectograms, and the population standard deviation is 6.6 hectograms.
How is the margin of error calculated in the example provided?
-The margin of error is calculated by multiplying the critical z-value (2.575 for a 99% confidence level) by the population standard deviation (6.6 hectograms) and then dividing by the square root of the sample size (195).
What is the confidence interval for the population mean in the example of baby boys' birth weights?
-The confidence interval for the population mean is from 31.5 hectograms to 33.9 hectograms, calculated by subtracting and adding the margin of error (approximately 1.217 hectograms) to the sample mean (32.7 hectograms).
What does it mean to say that we are 99% confident that the true population mean is within the confidence interval?
-It means that if we were to construct 100 confidence intervals using the same method and sample size, we would expect the true population mean to fall within 99 of those intervals.
Why might the bootstrapping method or non-parametric methods be used instead of the z or t distribution?
-The bootstrapping method or non-parametric methods might be used when the population is not normally distributed and the sample size is small, as these methods do not rely on the assumption of normality.
Outlines
📚 Understanding Confidence Intervals for Known Population Standard Deviation
This paragraph introduces the concept of calculating a confidence interval for the population mean when the population standard deviation is known. It explains the conditions under which this calculation is valid: either the original population is normally distributed or the sample size is greater than 30, allowing for a normal approximation of the sampling distribution. The formula for the confidence interval is presented, involving the sample mean, margin of error, critical z-score, population standard deviation, and the square root of the sample size. An example involving the birth weights of baby boys is used to illustrate the process, including checking the requirements, stating given information, computing the critical z-value, and constructing the confidence interval.
🔍 Calculating the Margin of Error and Confidence Interval
The second paragraph delves into the specifics of calculating the margin of error using the critical z-value, population standard deviation, and sample size. It provides a step-by-step guide on how to find the critical z-value for a 99% confidence level, either through a standard normal distribution table, a confidence level table, or using Excel's inverse norm function. The margin of error is then computed and used to determine the upper and lower limits of the confidence interval for the baby boys' birth weights. The paragraph emphasizes the importance of correct calculator input and offers help for students who may struggle with this process. It concludes with the interpretation of the confidence interval, explaining that it represents the range within which the true population mean is likely to fall with a certain level of confidence.
📉 Choosing Between Z-Scores and T-Scores for Confidence Intervals
The final paragraph discusses the decision-making process for choosing between using z-scores and t-scores when constructing confidence intervals. It clarifies that the z-distribution is used when the population standard deviation is known and the conditions for a normal distribution are met, either through a large sample size or an originally normally distributed population. Conversely, the t-distribution is used when the population standard deviation is unknown but the sample means can be normally distributed or approximated by a normal distribution. The paragraph also mentions alternative methods such as bootstrapping and non-parametric methods for cases where the population is not normally distributed and the sample size is small, although these are not covered in the course.
Mindmap
Keywords
💡Confidence Interval
💡Population Mean
💡Population Standard Deviation
💡Sampling Distribution
💡Sample Mean
💡Margin of Error
💡Critical z-Score
💡Normal Distribution
💡Sample Size
💡Confidence Level
💡Student's t-Distribution
Highlights
The video discusses learning outcome number five of lesson 7.2, focusing on finding and interpreting a confidence interval for the population mean when the population standard deviation is known.
Two conditions for using the formulas are identified: the original population should be normally distributed or the sample size should be greater than 30 for a normal distribution approximation.
The formula for the confidence interval when the population standard deviation is known is presented, involving the sample mean, margin of error, and a critical z-score.
An example is provided using a sample of 195 baby boys' birth weights to demonstrate the calculation of a 95% confidence interval.
The importance of checking the requirements for the sampling distribution of the sample means to be approximately normal is emphasized.
The process of determining the critical z-value for a 99% confidence level is explained, including finding the alpha value and using standard normal distribution tables or functions.
A step-by-step guide on calculating the margin of error using the critical z-value, population standard deviation, and sample size is provided.
The calculation of the upper and lower limits of the confidence interval is demonstrated using the sample mean and the margin of error.
The interpretation of the confidence interval is clarified, stating that the true population mean is likely within the interval with a 99% confidence level.
A distinction is made between using z-scores and t-scores, with z-scores being appropriate when the population standard deviation is known and certain normal distribution conditions are met.
Guidance is given on when to use the student t-distribution instead of the z-distribution, particularly when the population standard deviation is unknown.
The video mentions alternative methods like bootstrapping and non-parametric methods for cases where normal distribution assumptions are not met.
The importance of sample size in determining the distribution of sample means and the construction of confidence intervals is highlighted.
The video provides a clear explanation of how to interpret the constructed confidence interval in relation to the population mean.
A summary of the conditions under which the z-distribution should be used is provided, including knowledge of the population standard deviation and normal distribution of the original data set or large sample size.
The video concludes with a reminder that in both cases of using z or t distributions, it is crucial to ensure that the sample means can be approximated by a normal distribution.
Transcripts
Browse More Related Video
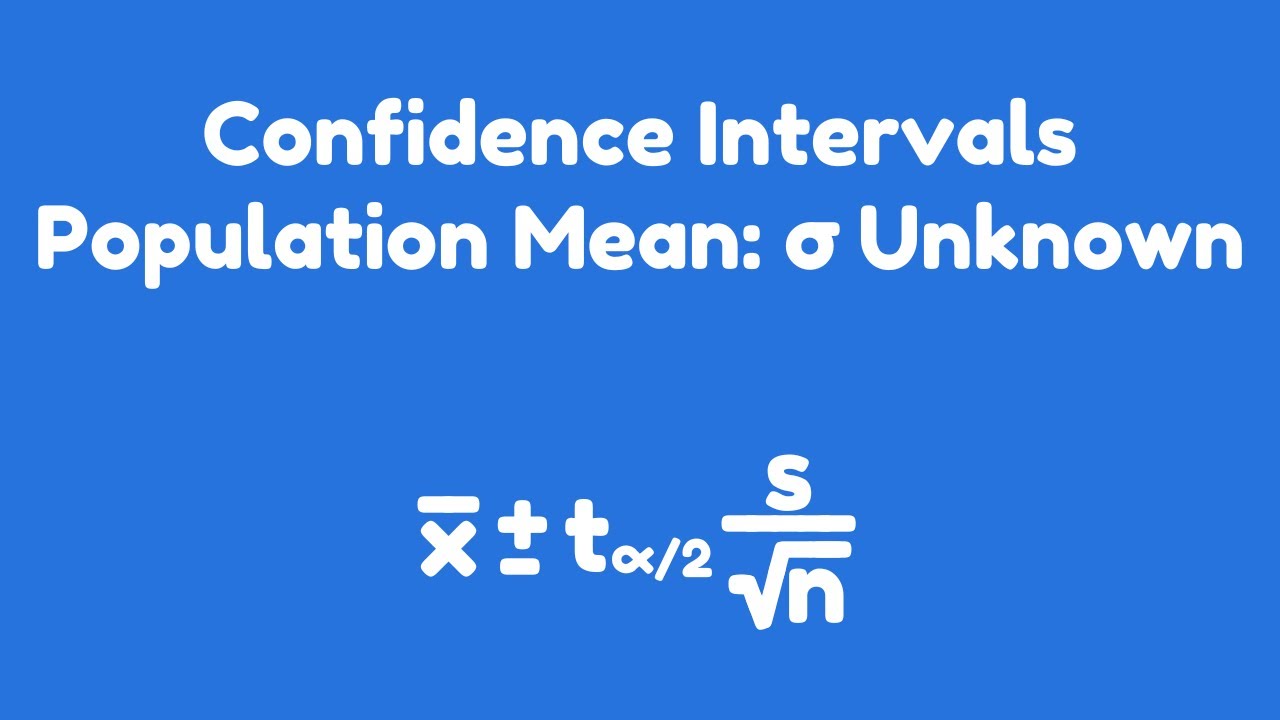
Confidence Intervals | Population Mean: σ Unknown
Deriving a Confidence Interval for the Mean (The Rationale Behind the Confidence Interval Formula)

Elementary Statistics - Chapter 7 - Estimating Parameters and Determining Sample Sizes Part 2
How To Find The Z Score, Confidence Interval, and Margin of Error for a Population Mean
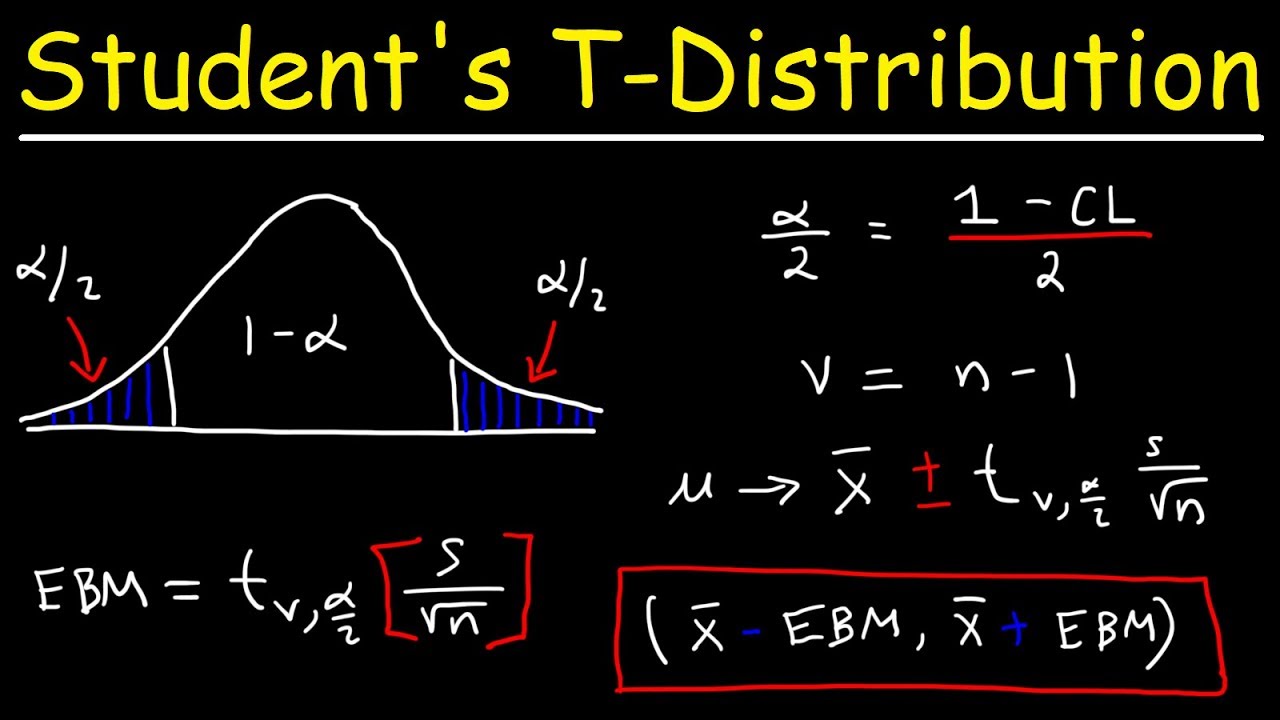
Student's T Distribution - Confidence Intervals & Margin of Error
Statistics 101: Confidence Intervals, Estimating Sample Size Needed
5.0 / 5 (0 votes)
Thanks for rating: