9.2.3 Two Means, Indep. Samples - Critical Value Method, St. Deviations Unknown, Not Assumed Equal
TLDRThis educational video script outlines the critical value method for testing claims about two means using sample data from independent groups, assuming unknown and unequal population standard deviations. It guides viewers through the hypothesis testing procedure, emphasizing the similarities with the p-value method, and illustrates the process with an example involving the impact of color on creativity. The script explains how to compute the test statistic, determine critical values, and make decisions about the null hypothesis, ultimately concluding whether there is sufficient evidence to support the original claim.
Takeaways
- 📚 The video discusses 'Learning Outcome 3' for Lesson 9.2, focusing on testing a claim about two means using sample data from two independent groups with unknown and unequal population standard deviations.
- 🔍 The rationale for using the critical value method is explained in more detail in a previous video (9.2.2), which also covers the p-value method.
- 📈 The procedure for the critical value method begins identically to the p-value method, with the same initial steps for hypothesis testing.
- 🧐 The video outlines the requirements for testing a claim about two means, including having two independent samples, both of which are simple random samples, and meeting conditions for normal distribution or large sample sizes.
- ✍️ The script emphasizes the importance of writing the claim symbolically to infer the null and alternative hypotheses, a crucial step in hypothesis testing.
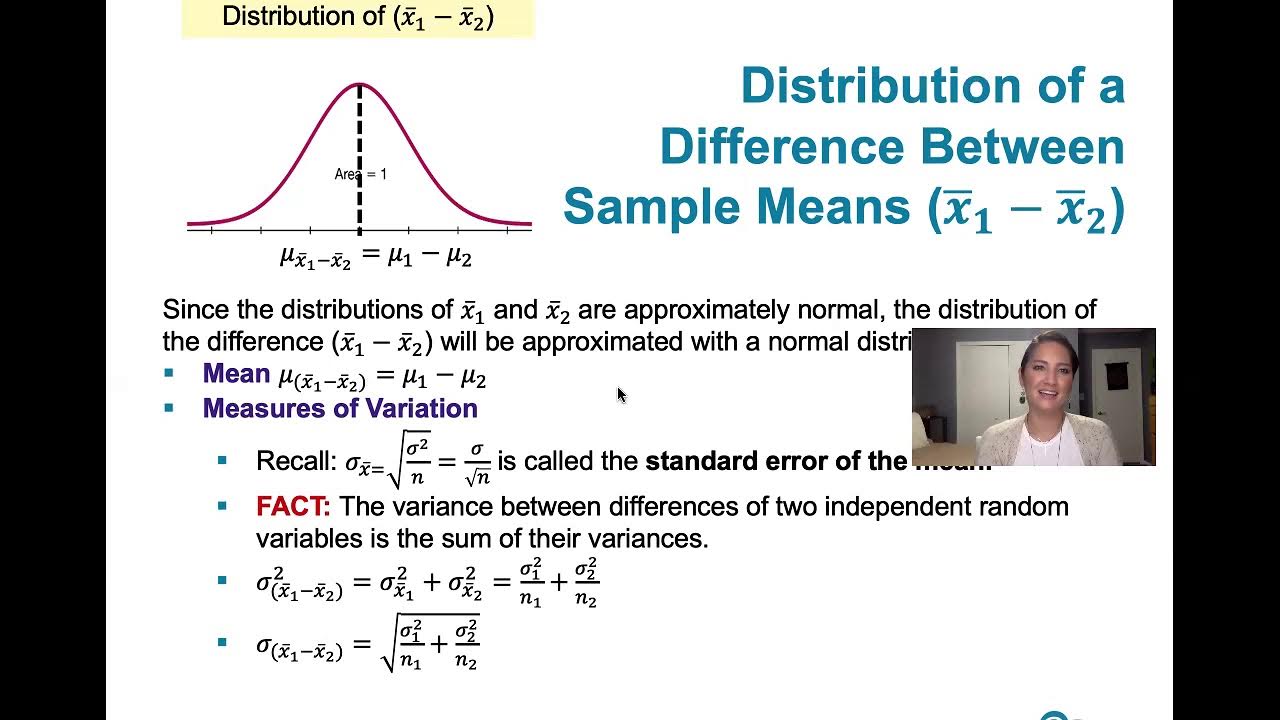
- 📊 The video recommends graphing the sampling distribution of the difference between sample means (x̄₁ - x̄₂) assuming the null hypothesis is true, to visualize the hypothesis test.
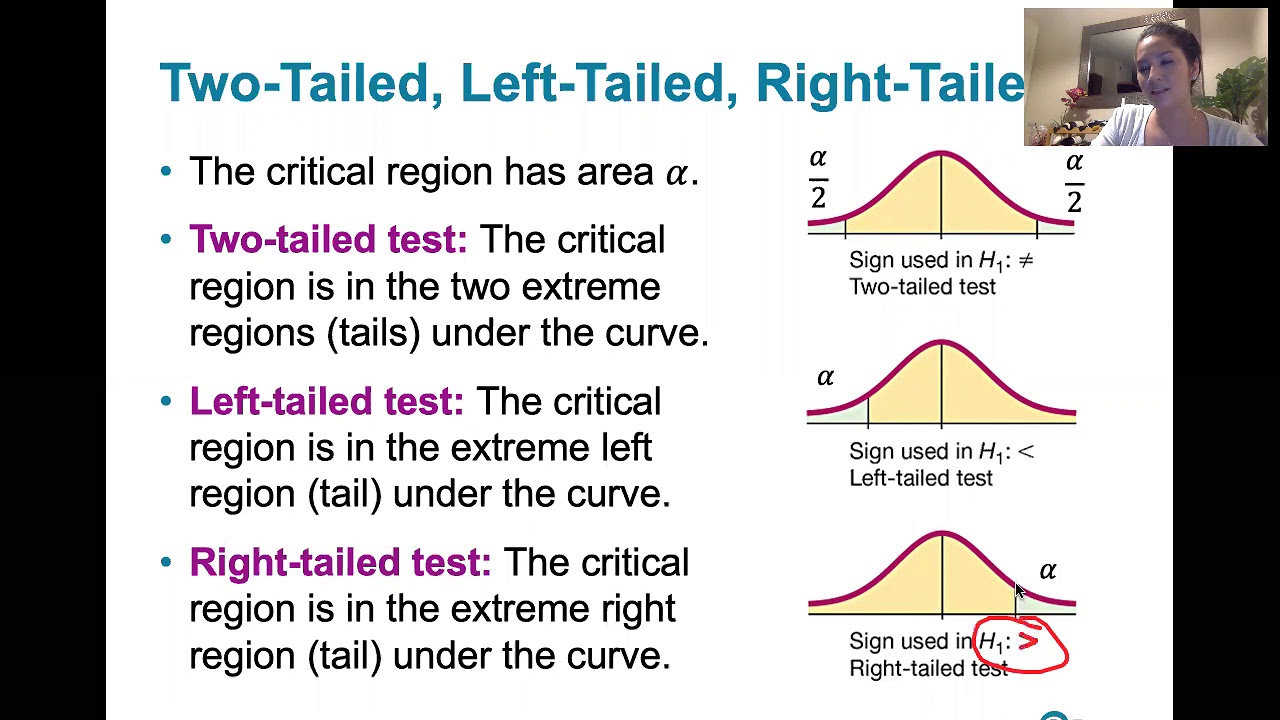
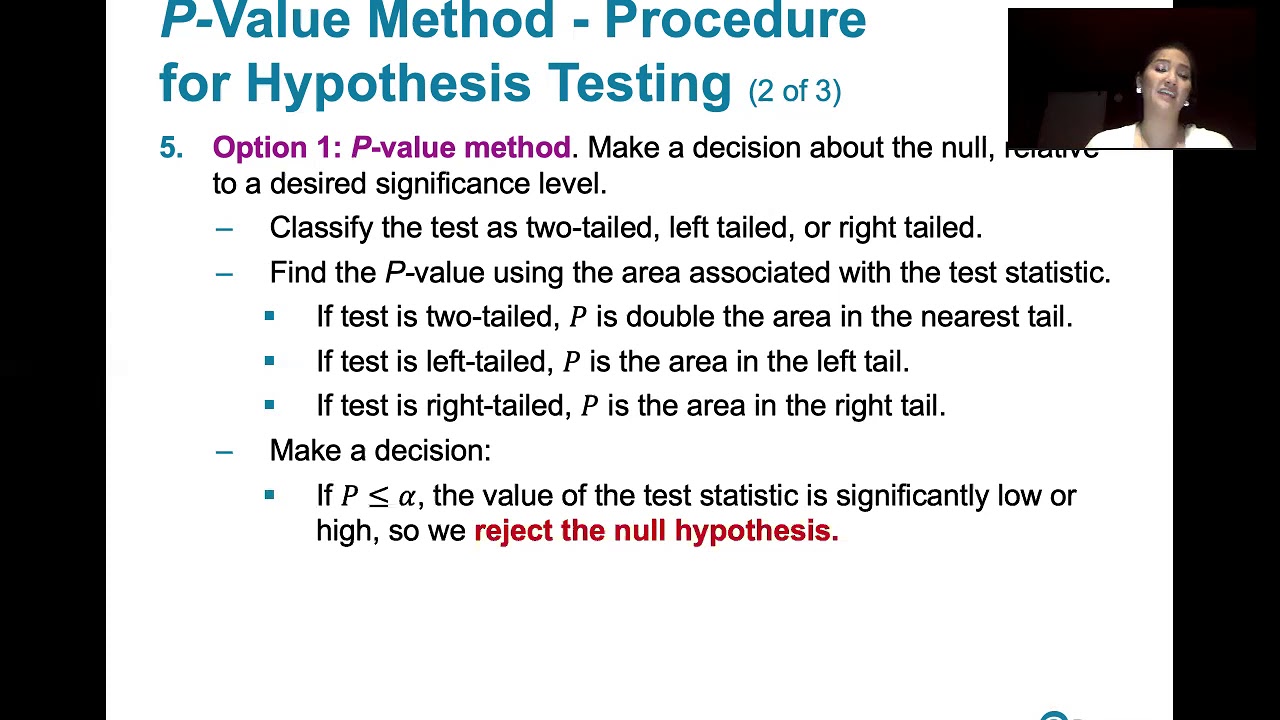
- 📉 The critical value method involves determining the type of test (two-tailed, left-tailed, or right-tailed) and sketching the critical region on the graph, which is different from the p-value method.
- 🔢 The test statistic is calculated using the formula for the difference between sample means, converted to a Student's t-distribution under the null hypothesis.
- 📉 After computing the test statistic, the critical values of t are identified, which are the cutoff values that determine the critical region for rejecting the null hypothesis.
- 🚫 The decision to reject or fail to reject the null hypothesis is based on whether the test statistic falls within the critical region.
- 💡 The final conclusion should be stated in non-technical terms to address the original claim, making it understandable to those without a background in statistics.
Q & A
What is the main topic of this video?
-The video discusses the critical value method for testing a claim about two means with sample data collected from two independent samples, assuming unknown and unequal population standard deviations.
What assumptions are made about the population standard deviations in this method?
-The method assumes that the population standard deviations are unknown and not equal to each other.
What are the requirements for testing a claim about two means using the critical value method?
-The requirements include having two independent samples, both of which are simple random samples, and either both sample sizes are large or both samples come from populations with normal distributions.
How does the critical value method differ from the p-value method?
-The critical value method and the p-value method start with the same steps, but they diverge in how they make decisions about the null hypothesis. The critical value method involves identifying critical values and shading the critical region, whereas the p-value method involves calculating a p-value and comparing it to the significance level.
What is the significance of graphing the sampling distribution of x-bar1 - x-bar2?
-Graphing the sampling distribution of x-bar1 - x-bar2 helps visualize the hypothesis testing process, particularly in determining whether the sample statistic is significantly high or low given the null hypothesis is true.
What is the purpose of identifying the null and alternative hypotheses?
-Identifying the null and alternative hypotheses is essential for setting up the hypothesis test, as they define what is being tested and what the claim is that the test is trying to support or refute.
How is the test statistic computed in this method?
-The test statistic is computed by taking the difference between the sample means, dividing it by an estimate of the standard deviation of the distribution of the difference between the sample means, and then using the square root of the sample sizes to adjust for the sample size.
What is a critical value and why is it important?
-A critical value is a t-score that separates the critical region from the rest of the area under the curve. It is important because it helps determine whether the observed sample statistic is significantly different from what would be expected under the null hypothesis.
How is the decision about the null hypothesis made using the critical value method?
-The decision about the null hypothesis is made by comparing the test statistic to the critical values. If the test statistic falls in the critical region (is significantly high or low), the null hypothesis is rejected; otherwise, it is not rejected.
What is the final step in the critical value method after making a decision about the null hypothesis?
-The final step is to state the conclusion about the original claim in non-technical terms, making it understandable for those who may not be familiar with statistical concepts.
Outlines
📊 Introduction to Hypothesis Testing with Critical Value Method
This paragraph introduces the critical value method for testing a claim about two means using sample data from two independent samples. It emphasizes that the population standard deviations are unknown and not assumed to be equal. The rationale behind this method is linked to the p-value method discussed in a previous video. The procedure begins with checking the requirements for testing two means, such as having large sample sizes or samples from normally distributed populations. The paragraph outlines the steps for hypothesis testing, including stating the null and alternative hypotheses, computing sample statistics, and visualizing the sampling distribution. It also explains the divergence between the critical value and p-value methods in terms of determining the critical region and test statistic.
🔍 Hypothesis Testing Procedure and Example Application
The paragraph delves into the detailed procedure of hypothesis testing, starting with the identification of sample sizes, means, and standard deviations. It suggests graphing the sampling distribution of the difference between sample means under the null hypothesis and labeling the sample statistic. The paragraph then discusses the computation of the test statistic and determining the nature of the test (two-tailed, left-tailed, or right-tailed). Using the same data from a previous video, the paragraph applies the critical value method to a research scenario where the effect of color on creativity is investigated. It guides through checking the requirements for the test, identifying null and alternative hypotheses, and computing the test statistic.
📉 Critical Value Determination and Test Statistic Comparison
This section explains how to determine the critical value for the test, which involves estimating the degrees of freedom and looking up the critical t-value from a table. It specifies that the test is left-tailed due to the alternative hypothesis's direction. The paragraph provides a step-by-step guide on finding the critical value using a conservative estimate of degrees of freedom and demonstrates how to graph the critical region and the test statistic. It concludes that if the test statistic falls within the critical region, the null hypothesis is rejected, indicating that the sample data suggests a significant difference.
❌ Null Hypothesis Rejection and Conclusion in Context
The paragraph discusses the decision-making process following the computation of the test statistic and its comparison with the critical value. It explains that if the test statistic is significantly low, as indicated by its position in the critical region, the null hypothesis is rejected. The paragraph also addresses alternative methods of determining the test statistic's significance, such as comparing absolute values. Finally, it connects the statistical findings back to the original claim about the effect of color on creativity, providing a conclusion that supports the claim that a blue background enhances creative performance.
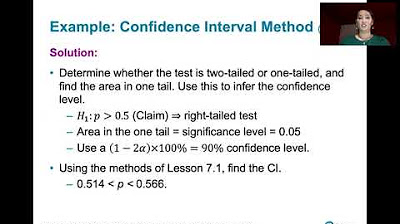
🚀 Summary of Critical Value Method and Preview of Confidence Interval Method
In the concluding paragraph, the video script summarizes the critical value method for hypothesis testing with two means, highlighting the steps taken and the rationale behind them. It also previews the next topic, which is the confidence interval method for estimating and testing claims about the difference between two population means. The paragraph assures that the upcoming discussion will cover when and how to apply the confidence interval method, especially when the population standard deviations are unknown and not assumed to be equal.
Mindmap
Keywords
💡Critical Value Method
💡Hypothesis Testing
💡Null Hypothesis
💡Alternative Hypothesis
💡Sample Standard Deviation
💡Test Statistic
💡Degrees of Freedom
💡Significance Level
💡Critical Region
💡Confidence Interval Method
Highlights
The video discusses learning outcome number three for lesson 9.2, focusing on testing claims about two means using the critical value method.
The critical value method is used when population standard deviations are unknown and not assumed to be equal.
The rationale for the critical value method is detailed in video 9.2.2, which covers the p-value method.
The procedure for the critical value method begins identically to the p-value method, with hypothesis testing requirements.
The video outlines the steps for the critical value method, emphasizing the similarities with the p-value method.
The critical value method is applicable when samples are large or come from populations with normal distributions.
Writing the claim symbolically helps infer the null and alternative hypotheses in hypothesis testing.
The video recommends graphing the sampling distribution of the difference between sample means under the null hypothesis.
The test statistic computation converts the distribution of the difference between sample means to a student t-distribution.
Determining the type of test (two-tailed, left-tailed, or right-tailed) is crucial before finding critical values.
Critical values of t are the cutoff scores that separate significant from non-significant results.
The decision to reject or fail to reject the null hypothesis is based on whether the test statistic falls in the critical region.
The conclusion should be stated in non-technical terms to be understood by those without a statistics background.
The video uses a study on the effects of color on creativity to illustrate the critical value method.
The researchers' claim that a blue background enhances creativity is tested using a 0.01 significance level.
The sample data provided includes sample sizes, means, standard deviations, and is used to compute the test statistic.
The test statistic is compared to the critical value to determine if the sample mean difference is significantly low.
The video concludes that there is sufficient evidence to support the claim that a blue background enhances creativity.
Transcripts
Browse More Related Video
9.2.2 Two Means, Independent Samples - The Rationale Behind The Equivalent Methods, P-value Method
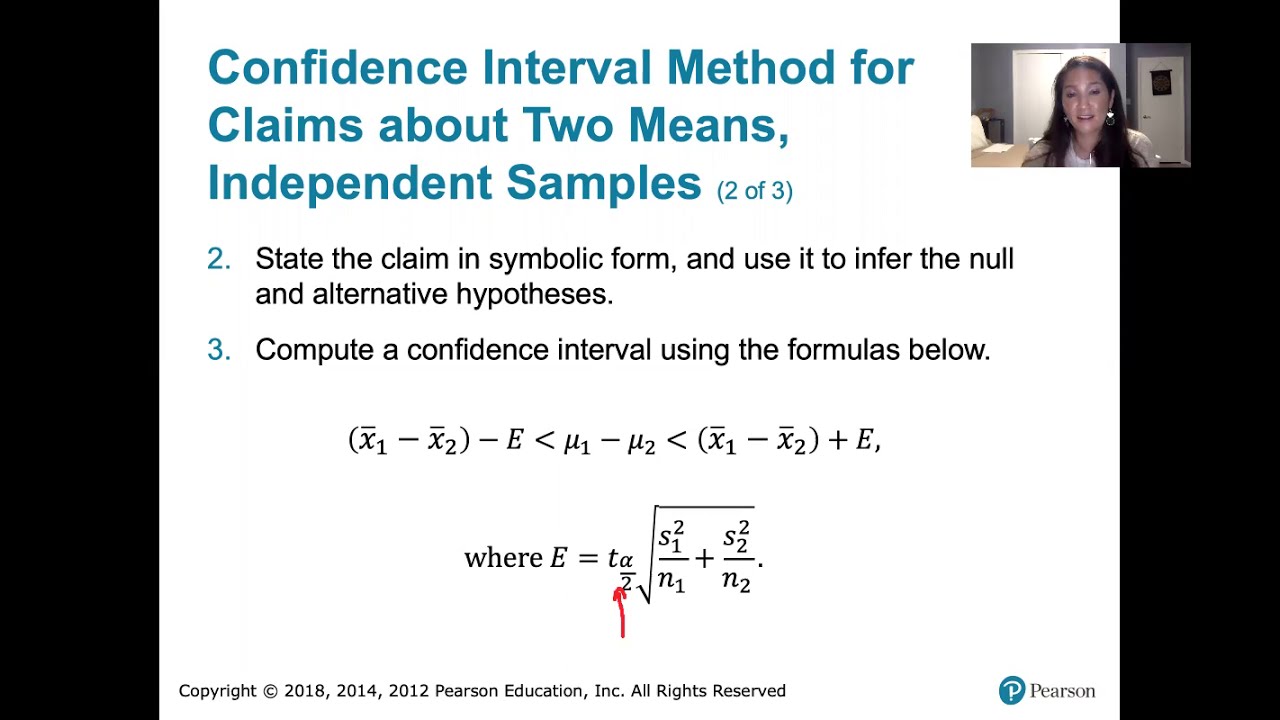
9.2.4 Two Means, Indep. Samples - Confidence Intervals, St. Deviations Unknown, Not Assumed Equal
9.1.1 Two Proportions - Rationale Behind Hypothesis Tests Involving Two Proportions
8.1.4 Basics of Hypothesis Testing - The Critical Value Method for a Population Proportion
8.2.1 Testing a Claim About a Proportion - P-value, Critical Value Methods, Normal Approximation
8.2.2 Testing a Claim About A Proportion - Confidence Interval Method, Comparison to Other Methods
5.0 / 5 (0 votes)
Thanks for rating: