Sampling from a Distribution, Clearly Explained!!!
TLDRIn this Stat Quest episode, the focus is on sampling from a distribution—a fundamental concept in statistics. The video uses a histogram of height measurements to illustrate how samples are taken at random based on the probabilities shown by the histogram or a smooth curve. The purpose of sampling is to explore statistical properties by running multiple tests and comparing the outcomes to expectations. The episode demonstrates how to use samples to assess the effectiveness of statistical tests like the T-test, providing insights into sample size and the frequency of obtaining significant results.
Takeaways
- 📚 Stat Quest is a video series produced by the genetics department at the University of North Carolina at Chapel Hill.
- 📊 The video discusses sampling from a distribution, a common practice in statistics.
- 🤖 Computers are used to pick random numbers based on the probabilities described by a histogram or a smooth curve representing the distribution.
- 🔍 The histogram in the video represents height measurements, with the tallest part showing where most measurements are likely to fall.
- 📉 The lower parts of the histogram indicate less likely measurements, such as people shorter than 4.5 feet or taller than 6.5 feet.
- 🔎 Sampling from a distribution helps to explore statistics by generating multiple samples that can be used in statistical tests.
- 🧐 By comparing the outcomes of statistical tests with the known original distribution, one can evaluate the accuracy and effectiveness of the tests.
- 📝 The script uses the example of T-tests to illustrate how sampling from a distribution can be used to determine the test's performance.
- 🔄 The process involves taking multiple samples and conducting numerous tests to understand the frequency of correct outcomes.
- 📈 The effectiveness of a statistical test, such as the T-test, can indicate whether the sample size needs to be adjusted.
- 🔚 The video concludes by encouraging viewers to tune in for the next episode of Stat Quest.
Q & A
What is the main topic of the StatQuest video?
-The main topic of the video is about sampling a distribution or getting samples from a distribution, which is a common task in statistics.
Why did the creators of StatQuest decide to make a video on this topic?
-The creators decided to make a video on this topic to have a reference material that they can point to instead of covering the same material repeatedly.
What does each red dot in the histogram represent in the video?
-Each red dot in the histogram represents a different person whose height was measured.
What does the height of the histogram indicate?
-The height of the histogram indicates the likelihood of measurements. The tallest part of the histogram shows where measurements are most likely, while the lower parts show where measurements are less likely.
How can the histogram be approximated for a smoother representation?
-The histogram can be approximated with a smooth curve, which is a common method to visualize the underlying distribution of the data.
What does it mean to take a sample from a distribution?
-Taking a sample from a distribution means using a computer to pick a random number based on the probabilities described by the histogram or the curve.
Why would one want to take a sample from a distribution?
-One would want to take a sample from a distribution to explore statistics. By generating lots of samples, one can plug them into statistical tests to see what happens and compare expectations with reality.
What is the significance of the T-test in the context of the video?
-The T-test is used as an example of a statistical test that can be applied to samples taken from a distribution. It helps to determine if the test is working correctly by comparing p-values obtained from the tests.
What does 'N' represent in the context of the video?
-'N' represents the number of measurements taken within each sample when discussing statistical tests.
How can one determine if they need to increase their sample size based on the video?
-One can determine if they need to increase their sample size by conducting many T-tests on samples from different distributions and observing how frequently the T-test gives a small p-value, indicating a significant difference.
What is the purpose of taking samples from a distribution or multiple distributions?
-The purpose is to generate a bunch of random numbers that reflect the probabilities of a distribution, allowing one to determine what a statistical test is capable of doing without doing much real work.
Outlines
📊 Introduction to Sampling from a Distribution
The video begins with a warm welcome to Stat Quest, a series produced by the genetics department at the University of North Carolina at Chapel Hill. The main topic of discussion is sampling from a distribution, a common practice in statistics. The video aims to provide a reference for this concept to avoid repetition. A histogram of height measurements is presented, with each red dot representing an individual's height. The histogram is used to illustrate the likelihood of different measurements, showing a peak between 5 foot 7 inches and 6 feet, indicating the most common heights measured. The video explains how to approximate the histogram with a smooth curve, a concept previously covered in a Stat Quest episode on statistical distributions. The purpose of sampling from a distribution is introduced as a means to explore statistics using computer-generated random numbers based on the histogram's probabilities.
Mindmap
Keywords
💡Sampling
💡Distribution
💡Histogram
💡Probability
💡Statistical Tests
💡T-test
💡P-value
💡Sample Size
💡Random Number
💡Computer Simulation
Highlights
Introduction to Stat Quest, a video series on statistical concepts.
The video is brought to you by the genetics department at the University of North Carolina at Chapel Hill.
The topic of the video is sampling from a distribution.
Sampling is a common practice in statistics, often covered in Stat Quest.
A histogram of height measurements is used as an example to illustrate the distribution.
The histogram shows the likelihood of different height measurements.
Most people measured were between 5 foot 7 inches and 6 feet tall.
Few measurements were taken for individuals shorter than 4.5 feet or taller than 6.5 feet.
Histogram can be approximated with a smooth curve for better visualization.
Explanation of what it means to take a sample from a distribution.
Computers generate random numbers based on the probabilities described by the histogram or curve.
The purpose of sampling is to explore statistics through computer-generated samples.
Original distribution is known, allowing for comparison of expectations to reality.
Example given of taking two samples and conducting T-tests.
T-tests are used to determine if the sample size needs to be increased.
Multiple T-tests can be conducted to evaluate the effectiveness of the statistical test.
The video concludes with an invitation to tune in for the next Stat Quest episode.
Transcripts
Browse More Related Video
Sampling Distributions: Introduction to the Concept
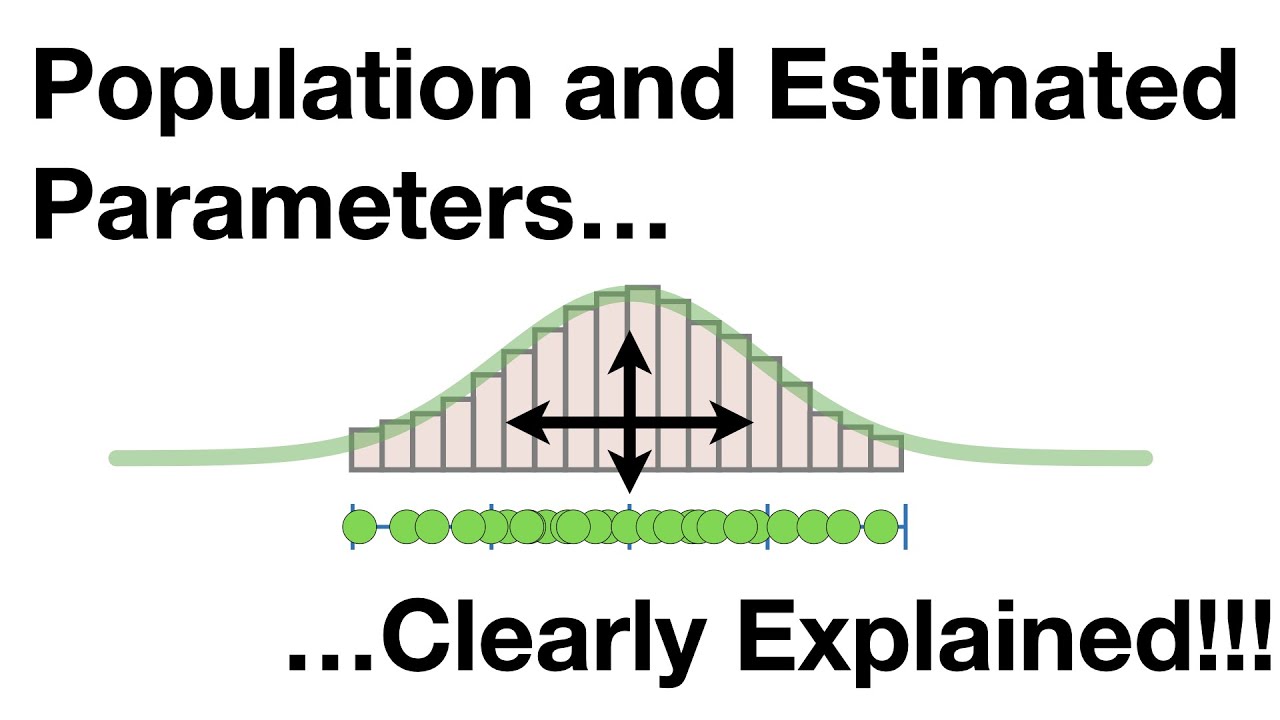
Population and Estimated Parameters, Clearly Explained!!!

The Main Ideas behind Probability Distributions

Sampling Distributions (7.2)
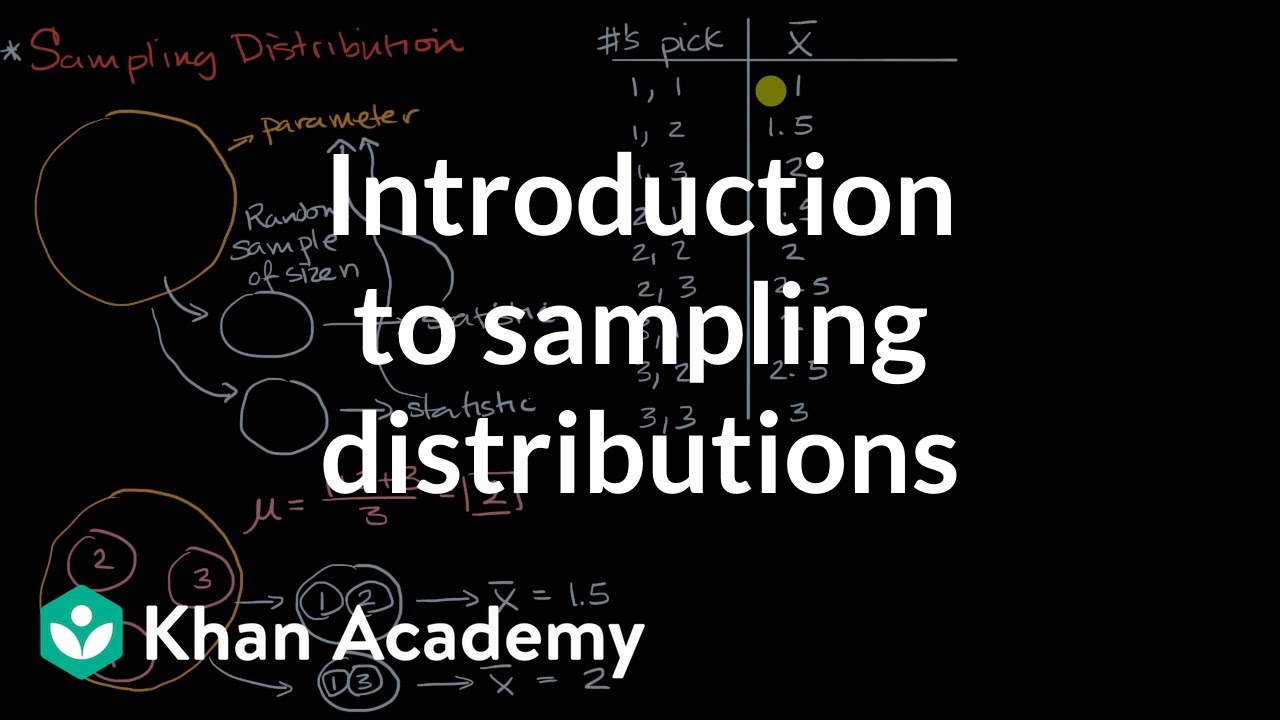
Introduction to sampling distributions | Sampling distributions | AP Statistics | Khan Academy
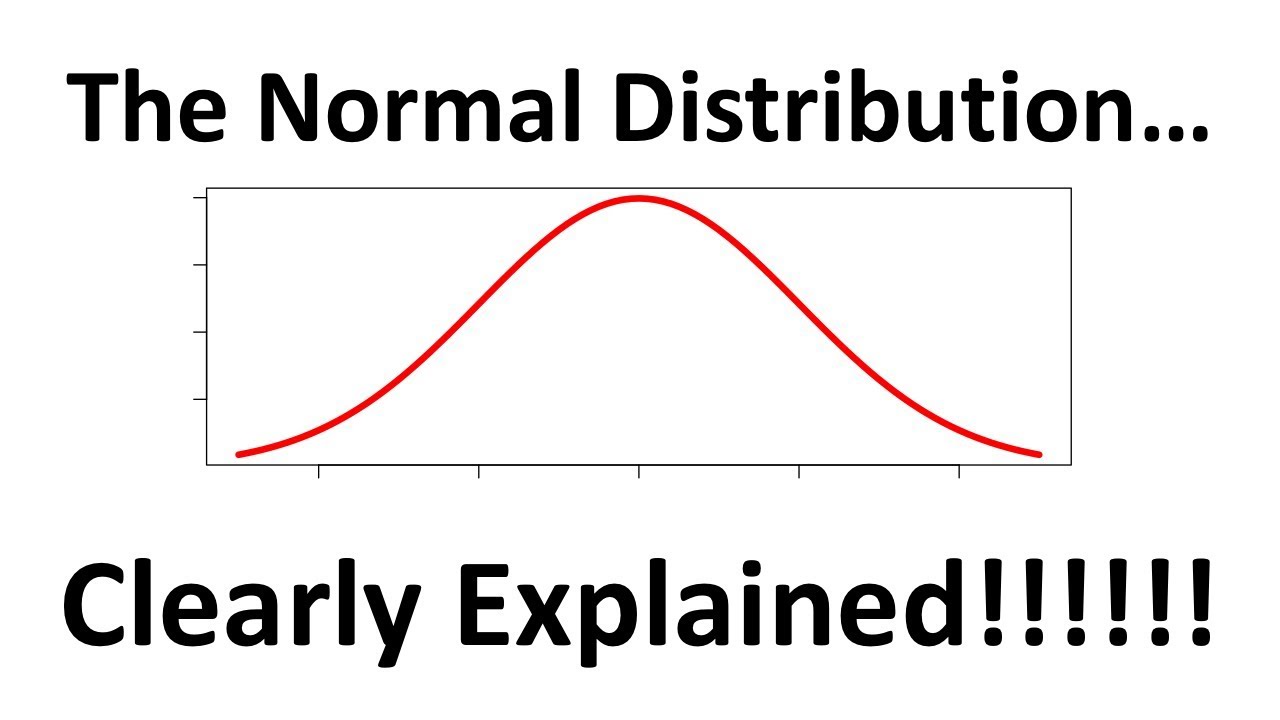
The Normal Distribution, Clearly Explained!!!
5.0 / 5 (0 votes)
Thanks for rating: