Measures of Central Tendency (Grouped Data) | Basic Statistics
TLDRThis instructional video teaches viewers how to calculate the mean, median, and mode for grouped data, using a table of age ranges as an example. It explains the process of finding the class mark, frequency, and lower class boundary, and then demonstrates the formulas for each measure. The video provides step-by-step calculations for the mean, median, and mode, concluding with the approximate mode of the age data set, highlighting the differences in approach compared to ungrouped data.
Takeaways
- 📊 The video teaches how to calculate the mean, median, and mode for grouped data, which is different from ungrouped data calculations.
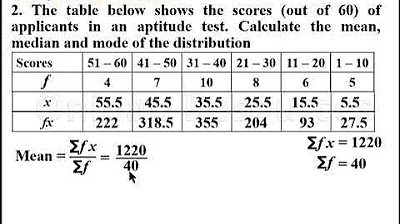
- 🔢 To find the mean, use the formula x-bar = Σ(F * X) / M, where F is frequency, X is the class mark, and M is the total frequency.
- 📈 The class mark (X) is the midpoint of the age range in each group, calculated by averaging the lower and upper bounds of the interval.
- 📚 The FX column is created by multiplying the frequency (F) by the class mark (X) for each age group.
- ✂️ Subtract 0.5 from the lower limit of each age interval to find the lower class boundary (LCB).
- 📝 The 'less than cumulative frequency' is calculated by summing the frequencies of all previous age groups.
- 🔍 The median class is determined by the half of the total frequency, which helps locate the row used for median calculation.
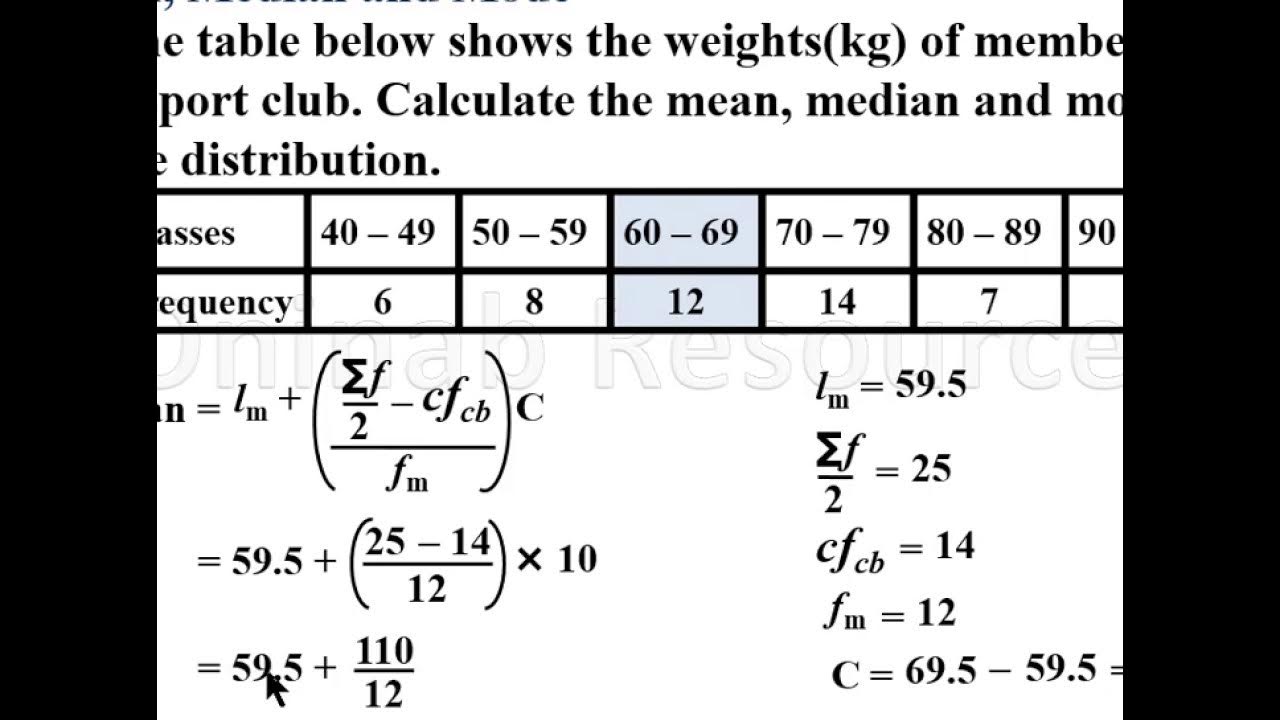
- 📉 The median is calculated using the formula X = LCB + ((a/2 - lower less than cumulative frequency) / frequency of median class * class interval).
- 📈 The mode for grouped data involves finding the class with the highest frequency, which is considered the modal class.
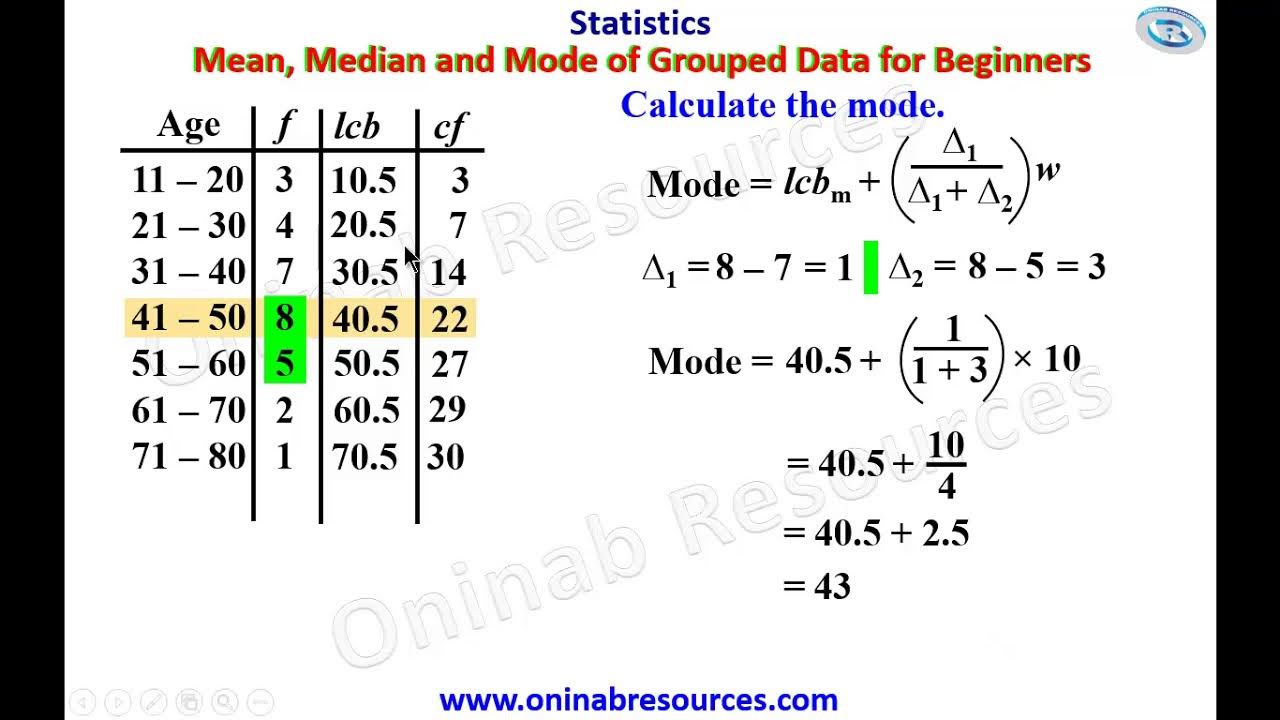
- 🔑 The mode calculation uses a formula that includes the lower class boundary, first and second differences, and the class interval.
- 👍 The video concludes by encouraging viewers to subscribe and suggest math topics to learn in the comments.
Q & A
What is the main topic of the video?
-The main topic of the video is teaching how to calculate the mean, median, and mode of grouped data.
What is the formula for calculating the mean of grouped data?
-The formula for calculating the mean of grouped data is \( \bar{x} = \frac{\sum (F \times X)}{M} \), where \( F \) is the frequency, \( X \) is the class mark, and \( M \) is the total frequency.
What is the class mark in the context of grouped data?
-The class mark is the middle value of the interval in grouped data, used to represent the range of values within that group.
How do you find the median class for calculating the median of grouped data?
-The median class is found by locating the class that contains the value closest to half of the total frequency (n/2) in the less than cumulative frequency column.
What is the formula for calculating the median of grouped data?
-The formula for calculating the median of grouped data is \( X_{med} = L_{CB} + \left(\frac{n/2 - CF_{lower}}{f_{median}}\right) \times w \), where \( L_{CB} \) is the lower class boundary, \( CF_{lower} \) is the lower cumulative frequency, \( f_{median} \) is the frequency of the median class, and \( w \) is the class width.
What is the difference between calculating the mode for grouped data versus ungrouped data?
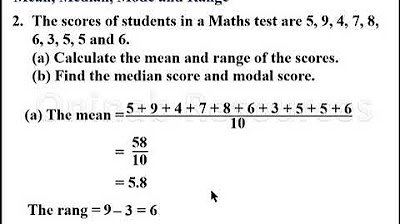
-For ungrouped data, the mode is the most frequently occurring value. For grouped data, the mode calculation involves using a formula that accounts for the intervals and frequencies, which may not directly reveal the most repeating number due to the grouped nature of the data.
How do you determine the modal class in grouped data?
-The modal class is determined by identifying the class with the highest frequency. If there are two classes with the highest frequency, both are considered modal classes.
What is the formula for calculating the mode of grouped data?
-The formula for calculating the mode of grouped data is \( \hat{x} = L_{CB} + \left(\frac{d_1 + d_2}{2}\right) \times \frac{w}{f_{modal}} \), where \( L_{CB} \) is the lower class boundary, \( d_1 \) and \( d_2 \) are the first and second differences, \( w \) is the class width, and \( f_{modal} \) is the frequency of the modal class.
Why is it necessary to calculate the lower class boundary (LCB) for grouped data analysis?
-The lower class boundary (LCB) is necessary for accurately determining the position of data within the intervals when calculating the median and mode, as it helps in pinpointing the exact value or range that corresponds to the calculated statistical measure.
What is the significance of the cumulative frequency in finding the median and mode of grouped data?
-The cumulative frequency helps in identifying the specific class or range of values that contains the median and mode. It is used to find the median class and modal class by locating the class that contains the value closest to half of the total frequency for the median and the class with the highest frequency for the mode.
How does the class interval affect the calculation of mean, median, and mode for grouped data?
-The class interval, which is the width of each group, affects the precision of the calculations. It determines the range of values each class mark represents and is used in the formulae for mean, median, and mode to ensure the calculations accurately reflect the distribution of the data.
Outlines
📊 Introduction to Group Data Mean Calculation
This paragraph introduces the concept of calculating the mean (average) of grouped data. It explains that the mean is calculated differently for grouped data compared to ungrouped data, and outlines the process of finding the mean by using the formula for the mean, which is the sum of the product of frequency (F) and class mark (X), divided by the total frequency (M). The paragraph also describes how to determine the class mark for each age group and how to calculate the frequency times the class mark (FX) for each group.
📈 Summation of FX and Calculation of Mean
The second paragraph continues the discussion on calculating the mean of grouped data by explaining how to sum the frequency times the class mark (FX) for all groups to get the total sum of FX. It also details the process of finding the total frequency (n) by summing all the individual frequencies in the dataset. The mean is then calculated by dividing the sum of FX by the total frequency (n), yielding the average age for the given data set.
🔍 Finding the Median of Grouped Data
This paragraph shifts focus to finding the median of grouped data. It explains the formula for calculating the median, which involves the lower class boundary, the total frequency divided by two, and the frequency of the median class. The process involves creating a new column for the lower class boundary and another for the less than cumulative frequency. The median class is identified by finding the row with the frequency closest to half of the total frequency. The median is then calculated using the formula provided.
📌 Calculating the Mode of Grouped Data
The fourth paragraph delves into the calculation of the mode for grouped data, which is more complex due to the lack of specific data points. It introduces the formula for the mode, which includes the lower class boundary, the first and second differences, and the class size. The modal class is determined by identifying the class with the highest frequency. The paragraph outlines the steps to calculate the first and second differences and how to use these values in the mode formula to find the most frequently occurring age group.
🎯 Conclusion and Call to Action
The final paragraph concludes the video script by summarizing the process of calculating the mean, median, and mode for grouped data. It emphasizes the importance of understanding the formulas and steps involved in these calculations. The speaker encourages viewers to subscribe to the channel and to leave comments with math topics they wish to learn, indicating an interactive approach to educational content creation.
Mindmap
Keywords
💡Mean
💡Median
💡Mode
💡Grouped Data
💡Class Mark
💡Frequency
💡Summation
💡Class Interval
💡Lower Class Boundary
💡Cumulative Frequency
💡First Difference
💡Second Difference
Highlights
Introduction to solving mean, median, and mode for grouped data.
Explanation of frequency distribution and class intervals.
Introduction of a new column for class mark (X) in the table.
Step-by-step calculation of the class mark for each interval.
Explanation and computation of the FX column (frequency times class mark).
Calculation of the total sum of FX and total frequency (N).
Derivation of the mean using the sum of FX and total frequency.
Introduction of the formula to find the median for grouped data.
Calculation of the lower class boundary for each interval.
Derivation of the less than cumulative frequency column.
Identification of the median class using cumulative frequency.
Substitution of values into the median formula and calculation.
Introduction of the formula to find the mode for grouped data.
Identification of the modal class based on highest frequency.
Computation of the first and second differences (D1 and D2) for the mode.
Final calculation and approximation of the mode.
Transcripts
Browse More Related Video


5.0 / 5 (0 votes)
Thanks for rating: