Descriptive Statistics vs Inferential Statistics | Measure of Central Tendency | Types of Statistics
TLDRThis video script offers an insightful overview of statistics, distinguishing between descriptive and inferential statistics. Descriptive statistics focuses on summarizing and presenting data effectively, utilizing measures of central tendency (mean, median, mode), spread (range, variance, standard deviation), and shape (symmetry and modality). Inferential statistics, on the other hand, is concerned with making predictions and inferences about a population based on sample data, involving confidence intervals, hypothesis testing, and regression analysis. The script is educational, providing clear examples and inviting viewers to engage through subscription, likes, and comments, and to participate in a quiz related to the topic.
Takeaways
- 📚 **Statistics Definition**: Statistics is a branch of mathematics that involves the collection, analysis, interpretation, presentation, and organization of data, used in various fields like business and finance.
- 📈 **Statistics Origins**: The field of statistics was first developed by a German philosopher and economist, often referred to as the 'father of statistics'.
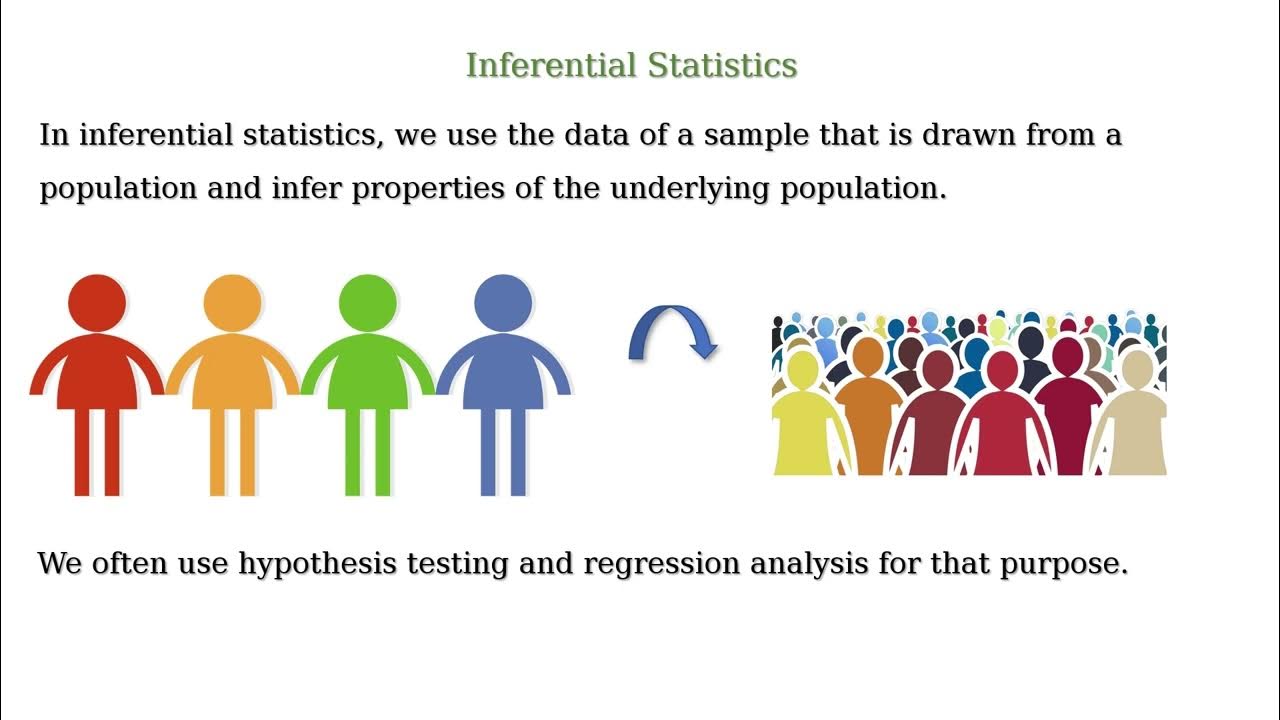
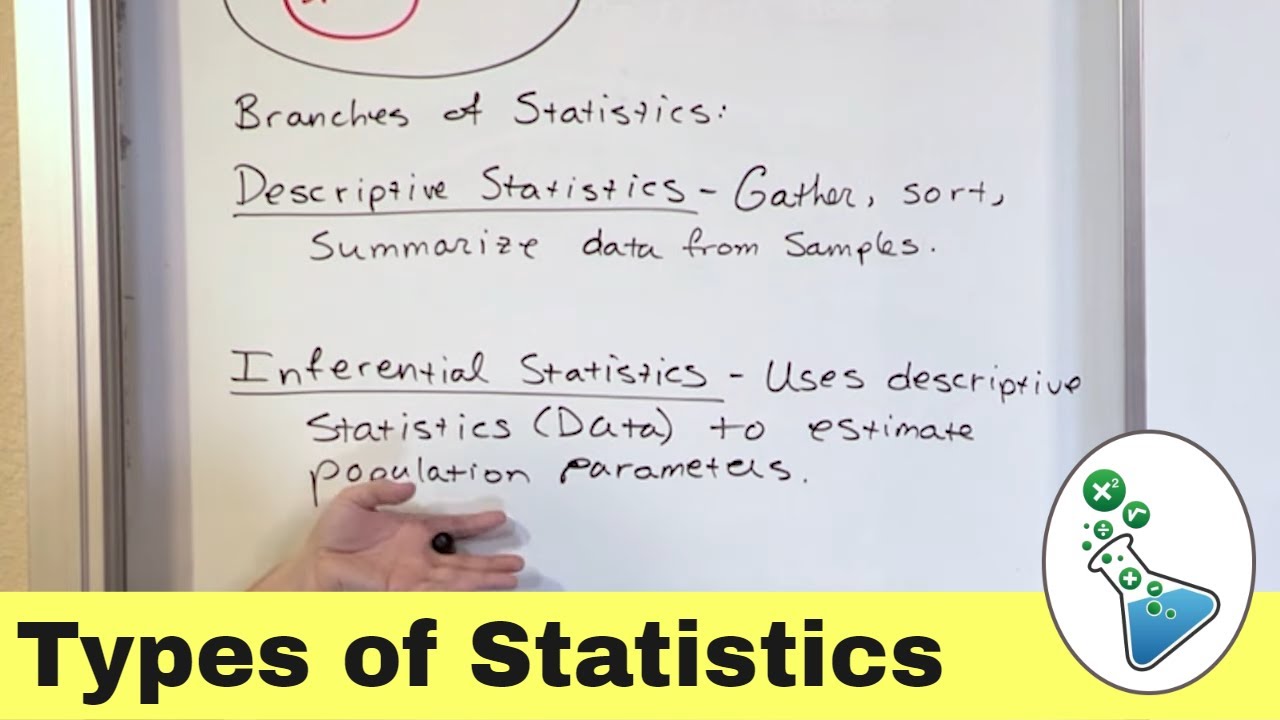
- 🔢 **Descriptive vs. Inferential Statistics**: Descriptive statistics summarize and present data, while inferential statistics make inferences and predictions about a population based on sample data.
- 🔍 **Measures of Central Tendency**: Descriptive statistics include measures of central tendency such as mean, median, and mode to describe the center of a data set.
- 📊 **Measure of Central Tendency Calculation**: The mean is calculated by summing all data points and dividing by the number of observations; the median is the middle value in an ordered data set; the mode is the most frequently occurring value.
- 📉 **Measures of Variability**: Descriptive statistics also include measures of spread or variability, such as range, variance, and standard deviation, to understand how data is dispersed.
- 🚶♂️ **Range Calculation**: The range is the difference between the maximum and minimum values in a data set.
- 🧮 **Variance and Standard Deviation**: Variance is the average of the squared differences from the mean, and standard deviation is the square root of variance, both indicating data spread.
- 📝 **Measure of Shape**: Descriptive statistics use measures of shape, including symmetry (skewness) and modality (unimodal, bimodal, multimodal), to describe the form of the data distribution.
- 🤔 **Inferential Statistics Components**: Inferential statistics include confidence intervals, hypothesis testing, and regression analysis to make predictions and inferences about populations.
- 📝 **Outliers Impact**: When a data set contains outliers, the median is often a more appropriate measure of central tendency than the mean, as it is less affected by extreme values.
- 🔗 **Additional Resources**: Further information on confidence interval, regression analysis, and hypothesis testing can be found in the presenter's YouTube channel, with links provided in the video description.
Q & A
What is the primary function of statistics?
-Statistics is a branch of mathematics that deals with the collection, analysis, interpretation, presentation, and organization of data. It is used in a wide variety of fields, including business, finance, and science.
Who is often referred to as the 'father of statistics'?
-Gottfried Wilhelm Leibniz, a German philosopher and economist, is often credited with the discovery of statistics and is known as the 'father of statistics'.
What are the two main branches of statistics?
-The two main branches of statistics are descriptive statistics and inferential statistics.
What does descriptive statistics focus on?
-Descriptive statistics focuses on summarizing and presenting data in a meaningful way.
What are the three measures of central tendency?
-The three measures of central tendency are the mean, median, and mode.
How is the mean calculated for a given set of data?
-The mean is calculated by summing all the data points and then dividing by the number of observations.
What is the formula for calculating the median of a data set?
-The median is found by arranging the data in ascending order. If the number of data points is odd, the median is the middle value. If even, the median is the average of the two middle values.
What is the mode in statistics?
-The mode is the most frequently occurring value in a data set.
What are the three components of the measure of spread or variability in a data set?
-The three components of the measure of spread or variability are range, variance, and standard deviation.
How is the range calculated?
-The range is calculated by subtracting the minimum value from the maximum value in a data set.
What is the difference between a symmetric and an asymmetric distribution in terms of shape?
-A symmetric distribution has equal areas on both sides of the mean, such as a normal distribution curve. An asymmetric distribution does not have this balance and can be either positively skewed (longer tail on the right) or negatively skewed (longer tail on the left).
What are the three types of modality in a distribution?
-The three types of modality are unimodal (one peak), bimodal (two peaks), and multimodal (more than two peaks).
What are the three components of inferential statistics?
-The three components of inferential statistics are confidence interval, hypothesis testing, and regression analysis.
Why is inferential statistics important?
-Inferential statistics is important because it allows us to make inferences and predictions about a population based on a sample of data.
Outlines
📊 Introduction to Statistics and Descriptive vs. Inferential Statistics
The first paragraph introduces the audience to the world of statistics, explaining that it is a branch of mathematics that deals with the collection, analysis, interpretation, presentation, and organization of data. It is used across various fields such as business and finance. The paragraph also mentions the origin of statistics, credited to a German philosopher and economist named Godfried, referred to as the 'father of statistics'. Statistics is further divided into two main types: descriptive and inferential. Descriptive statistics involves summarizing and presenting data in a meaningful way, while inferential statistics is concerned with making inferences and predictions about a population based on sample data. The paragraph provides a basic distinction between the two and sets the stage for a deeper discussion on descriptive statistics, including measures of central tendency, spread, and shape.
📈 Descriptive Statistics: Measures of Central Tendency, Spread, and Shape
This paragraph delves into the specifics of descriptive statistics, breaking it down into measures of central tendency, spread, and shape. It explains the calculation of the mean, median, and mode using a set of example data. The mean is calculated by summing all data points and dividing by the number of observations. The median is found by arranging the data in ascending order and selecting the middle value (or the average of the two middle values if the data set is even). The mode is identified as the most frequently occurring value in the data set. The paragraph then moves on to discuss measures of spread or variability, including the range, variance, and standard deviation, with examples of their calculation. Lastly, the concept of measure of shape is introduced, which includes symmetry and modality, explaining the difference between symmetric and asymmetric distributions, and the concepts of unimodal, bimodal, and multimodal distributions.
Mindmap
Keywords
💡Statistics
💡Descriptive Statistics
💡Inferential Statistics
💡Measure of Central Tendency
💡Measure of Spread
💡Range
💡Variance
💡Standard Deviation
💡Symmetry
💡Modality
💡Confidence Interval
💡Hypothesis Testing
💡Regression Analysis
Highlights
Statistics is a branch of mathematics that deals with the collection, analysis, interpretation, presentation, and organization of data.
Statistics is used in a wide variety of fields, including business, finance, and science.
Gottfried Wilhelm Leibniz, a German philosopher and economist, is considered the father of statistics.
Descriptive statistics focuses on summarizing and presenting data in a meaningful way.
Inferential statistics is concerned with making inferences and predictions about a population based on a sample of data.
Measures of central tendency include mean, median, and mode.
The mean is calculated by dividing the sum of all data by the number of observations.
The median is the middle value in a data set when arranged in ascending order.
Mode is the most frequently occurring value in a data set.
Measures of spread or variability include range, variance, and standard deviation.
Range is calculated as the maximum value minus the minimum value in a data set.
Variance measures the dispersion of data points around the mean.
Standard deviation is the square root of variance and indicates the spread of data.
Measures of shape analyze the distribution's symmetry and modality.
Symmetry can be symmetric, positively skewed, or negatively skewed based on the distribution's tail lengths.
Modality refers to the number of peaks in a distribution, which can be unimodal, bimodal, or multimodal.
Inferential statistics includes confidence intervals, hypothesis testing, and regression analysis.
Confidence intervals, hypothesis testing, and regression analysis are used to make inferences about a population from sample data.
The video provides a quiz for viewers to test their understanding of descriptive and inferential statistics.
The presenter encourages viewers to subscribe, hit the like button, and share the video with friends and colleagues.
Transcripts
Browse More Related Video

Descriptive Statistics: FULL Tutorial - Mean, Median, Mode, Variance & SD (With Examples)
Descriptive Statistics vs. Inferential Statistics

Introduction to Descriptive Statistics

Descriptive Statistics vs Inferential Statistics

Descriptive Statistics [Simply explained]
What is Descriptive Vs. Inferential Statistics?
5.0 / 5 (0 votes)
Thanks for rating: