Inferential Statistics FULL Tutorial: T-Test, ANOVA, Chi-Square, Correlation & Regression Analysis
TLDRThis video script introduces inferential statistics, contrasting it with descriptive statistics and explaining its purpose in testing whether observed patterns in a sample are likely to be found in the broader population. It covers common inferential tests such as T-tests, ANOVA, chi-square, and discusses correlation and regression analysis, emphasizing the importance of understanding statistical significance and the difference between correlation and causation.
Takeaways
- 📊 Inferential statistics allow us to test if patterns observed in a sample are likely present in the broader population or just a product of chance.
- 🔍 The concept of statistical significance helps determine if the observed differences are real or due to random variation.
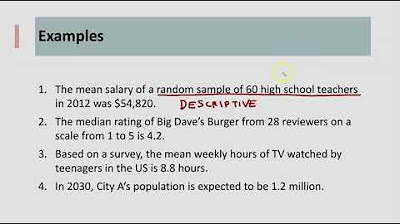
- 📈 Descriptive statistics summarize and organize data from a sample, while inferential statistics make predictions and test hypotheses about the population.
- 🔧 The sampling strategy's representativeness is crucial for inferential statistics to accurately reflect the population.
- 📝 Examples of common inferential tests include T-tests, ANOVA, Chi-Square, correlation, and regression.
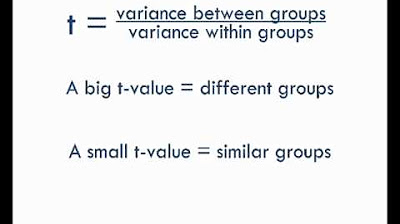
- 🔎 T-tests compare the means of two groups to assess if the difference is statistically significant, with different types for independent and paired samples.
- 🌟 ANOVA compares the means of more than two groups at once to determine if there are significant differences among them.
- 🔄 Chi-Square tests are used to assess if there's a significant relationship between two categorical variables.
- 📊 Correlation analysis evaluates the relationship between two numerical variables, measured by a correlation coefficient (R value).
- ⚠️ Correlation does not imply causation; it only indicates the presence of a relationship between variables.
- 🔮 Regression analysis extends correlation by enabling predictions of one variable based on the values of others, but it also does not prove causation.
Q & A
What is the main purpose of inferential statistics?
-The main purpose of inferential statistics is to test whether the patterns observed in a sample are likely to be present in the broader population or if they are just a product of chance.
How does inferential statistics differ from descriptive statistics?
-Descriptive statistics summarize and organize data from a sample, while inferential statistics use sample data to assess whether the patterns within the sample are likely to be present in the broader population and potentially make predictions about that population.
What is the concept of statistical significance?
-Statistical significance is the concept that helps determine if the observed patterns or differences are real or just due to chance. It is used to assess whether the difference between two means is statistically significant.
What is the role of sampling strategy in inferential statistics?
-The sampling strategy is crucial in inferential statistics because it affects whether the sample is representative of the population. If the sample is not representative, the inferential statistics may not accurately reflect the population.
What is a T-test and when is it used?
-A T-test is used to compare the means (averages) of two different groups to see if they are genuinely different or if the difference is just a product of chance, such as due to outliers or high variance.
What are the different types of T-tests?
-There are different types of T-tests, including the independent T-test, which compares the means of two different groups, and the paired T-test, which compares the mean of one group at different points in time.
What is ANOVA and how does it differ from a T-test?
-ANOVA (Analysis of Variance) is an inferential test that compares the means of more than two groups at once to assess whether the differences in the means are statistically significant. Unlike a T-test, which compares two groups, ANOVA can handle multiple groups.
What is the K Square test and when might it be used?
-The K Square test is used to assess whether there is a statistically significant relationship between two categorical variables. For example, it can be used to check if there's a link between gender and preference for a certain category of vehicle.
What is the difference between correlation and causation?
-Correlation indicates a statistical relationship between two variables, showing how they move together. However, it does not prove that one variable causes the other to change. Causation requires a specific research design that controls for most variables to establish a direct cause-and-effect relationship.
How does regression analysis help in making predictions?
-Regression analysis allows you to make predictions about the value of one variable (the dependent variable) based on the value of another variable or set of variables (the independent variables). For example, it can be used to predict house prices based on factors like the number of bedrooms, location, and age of the house.
What is the role of a correlation coefficient in correlation analysis?
-The correlation coefficient, also known as the R value, is a number between -1 and positive 1 that indicates the strength and direction of the relationship between two numerical variables. A value close to positive one indicates that the variables move together in the same direction, while a value close to negative one indicates they move in opposite directions.
Outlines
📊 Introduction to Inferential Statistics
This paragraph introduces the concept of inferential statistics, emphasizing its importance for those new to quantitative analysis. It outlines the plan for the video, which includes explaining what inferential statistics are, comparing them to descriptive statistics, and discussing common inferential tests such as T tests, Anova, K Square, correlation, and regression. The paragraph also mentions the availability of a free statistics cheat sheet and suggests watching a descriptive statistics video for better understanding.
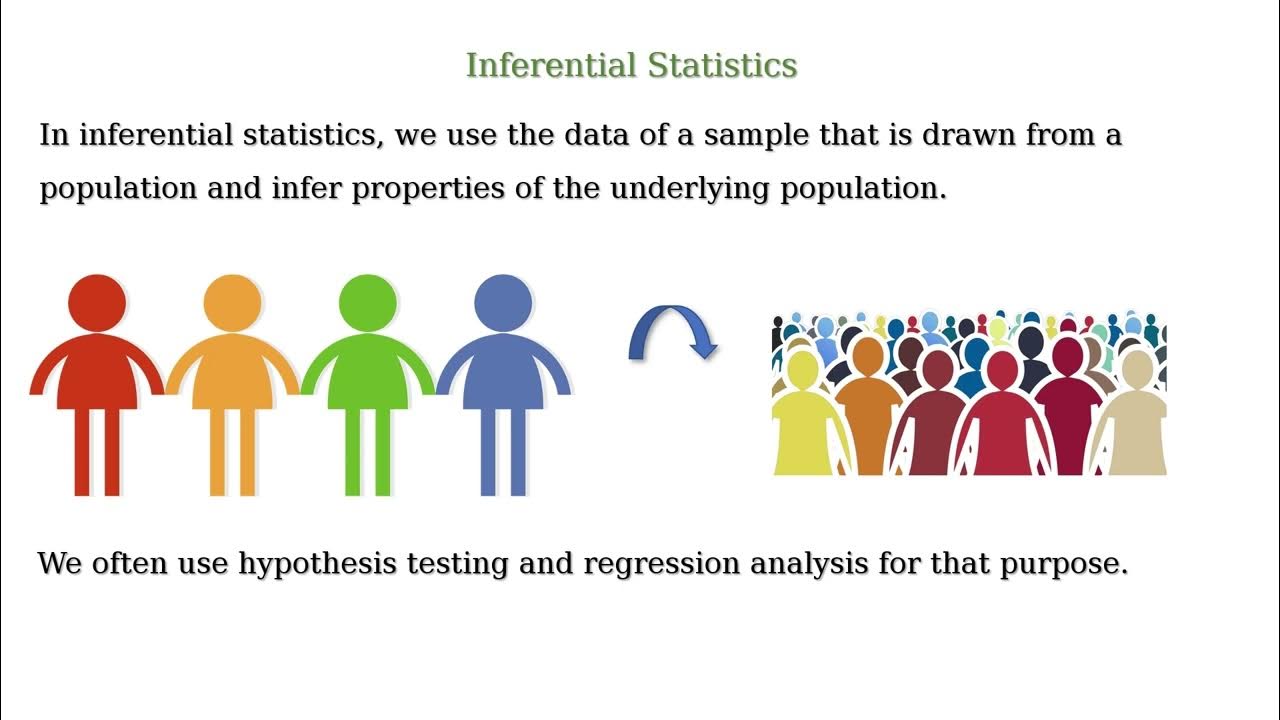
🔍 Understanding Inferential Statistics
The paragraph delves into the definition of inferential statistics, explaining how they allow for the testing of patterns observed in a data set (sample) against the broader population. It uses a practical example of surveying people's food preferences to illustrate how inferential statistics can determine if a pattern is likely to be present in the entire city or just a chance occurrence. The concept of statistical significance is introduced, and the importance of a representative sample is highlighted. The paragraph also differentiates inferential statistics from descriptive statistics, emphasizing that while descriptive statistics summarize and organize data, inferential statistics assess whether patterns in the sample are likely to be found in the population.
🧠 Common Inferential Tests Explained
This section provides an overview of several common inferential tests, including T tests, Anova, and K Square tests. It explains that a T test is used to compare the means of two different groups to assess statistical significance, while Anova compares the means of more than two groups. The K Square test is introduced as a method to assess the relationship between two categorical variables. The paragraph also mentions the existence of different types of these tests for various applications and the importance of selecting the appropriate test for the data. The availability of a free statistics cheat sheet is reiterated to aid in understanding and applying these tests.
📈 Correlation and Regression Analysis
The final paragraph discusses correlation and regression analysis. Correlation analysis is described as a method to understand the relationship between two numerical variables and how they move together, with the correlation coefficient (R value) indicating the strength and direction of the relationship. The paragraph cautions that correlation does not imply causation. Regression analysis is then explained as a tool for making predictions about the value of one variable based on others, using examples of predicting house prices and personal weight. The paragraph emphasizes that regression analysis also does not prove causation and that establishing causation typically requires a specific research design. The video concludes with a call to like, subscribe, and consider using the video creator's coaching service for hands-on help with research projects.
Mindmap
Keywords
💡Inferential Statistics
💡Descriptive Statistics
💡Statistical Significance
💡Sampling Strategy
💡T-Test
💡ANOVA
💡Chi-Square Test
💡Correlation Analysis
💡Regression Analysis
💡Causation
💡Research Design
Highlights
Inferential statistics allows testing if patterns observed in a sample dataset are likely present in the broader population or just a product of chance.
A practical example involves using inferential statistics to test if the preference for pizza among a surveyed sample of 100 people reflects the entire city's preference.
The concept of statistical significance is key in inferential statistics, assessing whether observed patterns are real or due to chance.
Inferential statistics are distinct from descriptive statistics, with the latter summarizing and organizing data from a sample.
T-tests are used to compare the means of two different groups to assess if the difference is statistically significant.
Anova (ANOVA) tests compare the means of more than two groups at once to determine statistical significance.
The K Square test assesses whether there's a statistically significant relationship between two categorical variables.
Correlation analysis evaluates the relationship between two numerical variables to see if they move together in a statistically significant way.
Regression analysis extends correlation by making predictions about the value of one variable based on another or a set of variables.
It's crucial to remember that correlation does not imply causation; one variable's change does not necessarily cause another's change.
The video provides a straightforward explanation of inferential statistics, making complex concepts accessible through plain language and examples.
Descriptive statistics describe the sample, while inferential statistics help understand if sample patterns are likely present in the broader population.
The video suggests watching a companion video on descriptive statistics for those unfamiliar with basic statistical terms.
Sampling strategy is crucial for inferential statistics to assume the sample is representative of the population.
The video offers a free statistics cheat sheet to help viewers fast-track their statistical analysis, accessible through a link in the description.
Different types of T tests exist, such as independent T tests and paired T tests, each with its own set of assumptions and requirements.
Oneway Anova is specifically mentioned as a type of Anova test suitable for comparing means across different groups, like school types or store locations.
The video emphasizes the importance of selecting the right statistical test for the data to avoid meaningless results.
Transcripts
Browse More Related Video
Statistics made easy ! ! ! Learn about the t-test, the chi square test, the p value and more
Quantitative Data Analysis 101 Tutorial: Descriptive vs Inferential Statistics (With Examples)
Descriptive Statistics vs. Inferential Statistics

How To Know Which Statistical Test To Use For Hypothesis Testing
Descriptive vs Inferential Statistics
StatsCast: What is a t-test?
5.0 / 5 (0 votes)
Thanks for rating: