Calculating a p-value for a Two-tailed Test
TLDRThis video script offers a clear explanation on how to calculate the p-value for a two-tailed hypothesis test concerning the proportion of voters favoring a particular candidate. The scenario involves testing if the preference for Candidate 'A' significantly differs from a given proportion of 0.86. The script guides the viewer through the process of using a standard normal distribution with a z-test statistic of 1.675. It explains how to find the area under the curve corresponding to the right tail and then double it to account for the left tail, as this is a two-tailed test. The video demonstrates the use of Google Sheets to find the area of the right tail, which is approximately 0.04967, and then multiplies this by two to get the total p-value of 0.0939. The summary emphasizes the step-by-step methodology, making it accessible for viewers to understand hypothesis testing in the context of proportions.
Takeaways
- 📊 Conducting a two-tailed hypothesis test to determine if the proportion of voters preferring Candidate 'A' significantly differs from 0.86.
- 📈 The test statistic (z) is calculated to be 1.675, indicating the position relative to the mean in standard deviations.
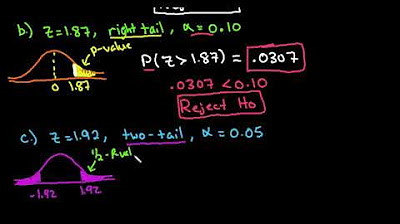
- 📉 The p-value is the sum of the areas in the two tails of the standard normal distribution that exceed the test statistic.
- 🔍 The standard normal distribution is used because the test statistic is a z-score, with a mean of zero and a standard deviation of one.
- 📍 The right tail area corresponding to the test statistic of 1.675 is found using a tool like Google Sheets.
- 🔢 The area to the right of 1.675 (right tail area) is approximately 0.04967 when calculated.
- 🔁 Since it's a two-tailed test, the left tail area is the same as the right tail area, also 0.04967.
- 🤝 To find the total p-value, multiply the area of one tail by 2, accounting for both tails in the test.
- 📝 The final p-value, after rounding to four decimal places, is 0.0939, representing the total area in both tails.
- 🔧 Utilizing tools like Google Sheets can facilitate the calculation of p-values and areas under the standard normal curve.
- 📚 Keeping more decimal places in intermediate steps can lead to a more accurate final p-value.
- 👍 The video provides a step-by-step guide on how to calculate the p-value for a two-tailed hypothesis test using a z-score.
Q & A
What is the main topic of the video?
-The main topic of the video is about one sample hypothesis testing, specifically calculating the p-value.
What is the context of the study in the video?
-The context is a study to determine if the proportion of voters who prefer Candidate 'A' is significantly different from 0.86.
What type of hypothesis test is being performed?
-A two-tailed test is being performed.
What is the test statistic obtained from the sample data?
-The test statistic obtained is a z-score of 1.675.
What is the p-value in the context of hypothesis testing?
-The p-value is the area under the curve in the tails of the distribution that represents the probability of observing a test statistic as extreme as, or more extreme than, the one calculated from the sample data.
Why is the p-value calculated as the sum of the areas of two tails?
-The p-value is the sum of the areas of two tails because it's a two-tailed test, which means we are interested in deviations from the null hypothesis in both directions.
What distribution is being used for the test statistic in this video?
-The standard normal distribution is being used since the test statistic is a z-score.
What is the mean and standard deviation of the standard normal distribution?
-The mean of the standard normal distribution is 0 and the standard deviation is 1.
How does one find the area of the right-hand tail for the given z-score?
-One can find the area of the right-hand tail using a tool like Google Sheets, which has a function to compute the area under the normal distribution curve from a given lower bound to positive infinity.
What is the calculated area of the right-hand tail for the z-score of 1.675?
-The calculated area of the right-hand tail is approximately 0.04967.
How is the final p-value calculated for a two-tailed test?
-The final p-value for a two-tailed test is calculated by multiplying the area of one tail by 2, which accounts for the area in both tails.
What is the final p-value obtained from the video?
-The final p-value obtained is 0.0939, after rounding to four decimal places.
Outlines
📊 Hypothesis Testing and Calculating the p-value
This paragraph introduces a video on hypothesis testing, specifically focusing on calculating the p-value. The context is a study to determine if the proportion of voters favoring Candidate 'A' is significantly different from 0.86, using a two-tailed test. The sample data yields a z-score of 1.675, which is used to find the p-value. The p-value is the combined area under the standard normal distribution curve in the tails beyond the test statistic. The mean for the standard normal distribution is zero, and the test statistic's location to the right signifies the area of the right tail. The left tail's area is identical. Using Google Sheets, the right tail's area is calculated with the lower bound as 1.675 and the upper bound as a very large positive number (represented as six nines). The computed area for the right tail is approximately 0.04967, and since it's a two-tailed test, this value is multiplied by 2 to get the total p-value, which is 0.0939 when rounded to four decimal places.
Mindmap
Keywords
💡hypothesis testing
💡p-value
💡two-tailed test
💡test statistic
💡z-score
💡standard normal distribution
💡tail area
💡Google Sheets
💡mean
💡standard deviation
💡null hypothesis
💡significance level
Highlights
The video is about one sample hypothesis testing and calculating the p-value.
The study aims to determine if the proportion of voters who prefer Candidate A is significantly different from 0.86.
A two-tailed test is being performed.
The sample data produces a test statistic z = 1.675.
The p-value is the area of the tails under the curve.
For a two-tailed test, the p-value is the sum of the areas of the right and left tails.
The test statistic z = 1.675 is from the standard normal distribution with mean 0 and standard deviation 1.
The area of the right tail can be found using the test statistic and the standard normal distribution.
The area of the left tail will be the same as the right tail in a two-tailed test.
Google sheets can be used to calculate the area of the right tail with a lower bound of 1.675 and an upper bound of positive infinity.
The area of the right tail is approximately 0.04967.
The area of the left tail is also 0.04967.
The p-value is calculated by multiplying the area of one tail by 2 for a two-tailed test.
The final p-value is 0.0939 when rounded to four decimal places.
The p-value represents the total area of the tails under the curve.
The video provides a step-by-step guide to calculating the p-value in a two-tailed hypothesis test.
The standard normal distribution is used to find the areas of the tails for the p-value calculation.
Google sheets is a useful tool for calculating the area of the tails and finding the p-value.
The video demonstrates the practical application of hypothesis testing in determining if a proportion is significantly different from a given value.
Transcripts
Browse More Related Video
Finding P-Value for a Z-Test Using the TI-84

Finding a P-value given the test statistic

Elementary Stats Lesson #18
Elementary Statistics - Chapter 8 - Hypothesis Testing Part 3 Revised

Using a z-score to complete hypothesis testing for a claim of equality
9.1.3 Two Proportions - Example, Critical Value Method, Normal Approximation
5.0 / 5 (0 votes)
Thanks for rating: