P Values, z Scores, Alpha, Critical Values
TLDRThis video script offers an insightful discussion on statistical concepts that often perplex students, namely P values, alpha levels, z-scores, and critical values. The presenter begins by illustrating critical values in the context of a 95% confidence level, explaining how they define the rejection region on a bell curve. The script then delves into the process of comparing calculated z-scores to critical values to determine the validity of the null hypothesis. The concept of alpha is introduced as the area in the tails of the distribution, which is crucial for two-tailed tests. The script also clarifies the role of P values in assessing the significance of results, demonstrating how to calculate or look up exact P values using a standardized table. The presenter emphasizes the importance of understanding these statistical tools for both academic and professional research, encouraging viewers to explore related videos for a deeper comprehension of the subject.
Takeaways
- 📊 **Critical Values**: These mark the boundary of the rejection region in a hypothesis test, determining whether to reject the null hypothesis based on the test statistic.
- 🎯 **95% Confidence Level**: The video uses a 95% confidence level, which implies a 5% chance of rejecting the null hypothesis when it is true (Type I error).
- 🟥 **Rejection Region**: The area beyond the critical value where the null hypothesis is rejected. In a two-tailed test, this area is split between the two tails of the distribution.
- 🔢 **Z-Score Comparison**: The calculated z-score from a test is compared against the critical value to decide if the null hypothesis should be rejected.
- 🌿 **Alpha (α)**: Represents the total area in the tails of the distribution (5% in this case), which is the probability of a Type I error.
- 🧮 **Calculating Alpha**: Alpha is split evenly between the two tails of the distribution, hence α/2 represents the critical value for each tail.
- 📉 **P-Value**: Indicates the probability of observing a result as extreme as, or more extreme than, the one calculated from the data, assuming the null hypothesis is true.
- 📈 **Z-Score and P-Value**: A z-score of 2.6 leads to a p-value less than 0.025, showing a significant result that falls in the rejection region.
- 🔍 **Looking Up P-Values**: The exact p-value can be found using a standard normal distribution table or calculated precisely.
- 📚 **Statistical Tables**: Reference tables provide z-scores and their corresponding p-values, which are crucial for hypothesis testing.
- 📝 **Reporting P-Values**: It's acceptable to report a p-value as either the exact value (e.g., 0.0047) or as less than a threshold (e.g., <0.025), depending on requirements.
- 📌 **Submission Standards**: When submitting to a journal, adhere to the specific guidelines regarding how to report p-values and statistical significance.
Q & A
What are the statistical concepts discussed in the video?
-The video discusses P values, alpha, z-scores, and critical values, focusing on their commonalities and differences.
What is the significance of a critical value in hypothesis testing?
-A critical value is the boundary of the rejection region in a hypothesis test. If the test statistic falls into the rejection region, the null hypothesis is rejected.
What is the confidence level discussed in the video?
-The video discusses a 95% confidence level, which means that 95% of the observations fall within the confidence interval.
How is the rejection region determined in a hypothesis test?
-The rejection region is determined by the critical value, which marks the boundary. If the test statistic is beyond this boundary, the null hypothesis is rejected.
What does the z-score represent in the context of the video?
-In the video, the z-score represents the test result of a statistical experiment. It is compared to the critical value to decide whether to reject the null hypothesis.
How is alpha related to the tails of the distribution in a two-tailed test?
-Alpha is the total area in the tails of the distribution. In a two-tailed test, alpha is divided by two and placed in both tails, representing the probability of a type I error.
What does the term 'P-value' signify in statistics?
-The P-value is the probability of obtaining a result as extreme as, or more extreme than, the observed result under the assumption that the null hypothesis is true. It indicates the significance of the result.
How can one find the exact P-value for a given z-score?
-The exact P-value can be found by looking up the z-score in a standard normal distribution table or by calculating it using statistical software or formulas.
What is the relationship between the P-value and the area under the curve in a standard normal distribution?
-The P-value corresponds to the area under the curve of the standard normal distribution to the right of the observed z-score in a one-tailed test, or split between both tails in a two-tailed test.
Why is it important to understand the concept of a 'two-tailed test'?
-A two-tailed test is important because it considers the possibility of extreme results in both directions from the mean, not just one. This makes it more sensitive to detecting significant differences or effects.
What does the video suggest for further learning?
-The video suggests that viewers watch related videos for a deeper understanding of the concepts discussed, such as how to calculate P-values and work with z-scores.
How can one enhance their understanding of statistical concepts like P-values, alpha, and z-scores?
-One can enhance their understanding by practicing with real data, referring to statistical tables, using software tools, and engaging with educational resources like the videos mentioned in the script.
Outlines
📊 Understanding Critical Values, Z-Scores, and P-values
This paragraph introduces the concepts of critical values, Z-scores, and P-values, which are often confusing for students. The speaker uses a bell curve to illustrate these concepts and focuses on a 95% confidence level. Critical values are explained as the boundary of the rejection region in a statistical test. The video shows how a Z-score of 2.6 falls within the rejection region, leading to the rejection of the null hypothesis. Alpha is described as the area in the tails of the distribution, which in this example is 0.025 for a two-tailed test. The P-value is introduced as a measure of significance, with the speaker calculating it to be less than 0.025 for the Z-score of 2.6. The exact P-value is further explored, with the speaker demonstrating how to find it in a normalized table or calculate it, resulting in an exact P-value of 0.0047.
📈 P-value Reporting and Submission Guidelines
The second paragraph discusses how to report P-values and the flexibility in presenting them. It is mentioned that one can report the P-value as either equal to 0.0047 or less than 0.0250, and both are considered correct. The choice depends on the requirements set by an academic professor or a journal to which one might be submitting research. The speaker also encourages viewers to watch related videos for a deeper understanding and to share the knowledge on social media platforms. The paragraph ends with a call to action for viewers to subscribe and engage with the content.
Mindmap
Keywords
💡Critical Values
💡Confidence Level
💡Rejection Region
💡Z-Score
💡Null Hypothesis
💡Alpha
💡P-Value
💡Two-Tailed Test
💡Bell Curve
💡Significance Level
💡Type I Error
💡Normalized Table
Highlights
The video discusses P values, alpha, z-scores, and critical values, which are common points of confusion for students.
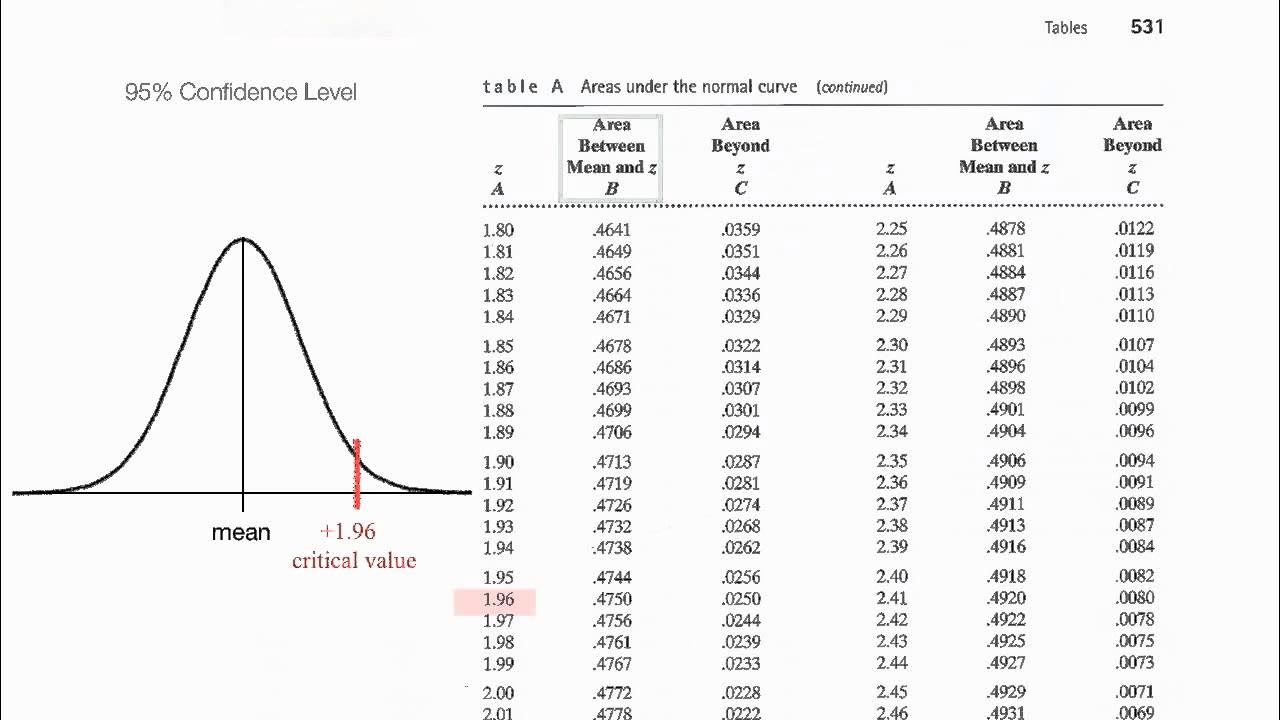
A 95% confidence level is introduced, with 1.96 as the critical value for the rejection region.
Critical values act as the boundary of the rejection region in hypothesis testing.
The concept of a z-score is explained, with an example of 2.6 being in the rejection region.
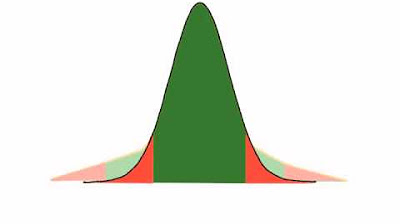
Alpha is defined as the area in the tails of the distribution, calculated as 0.025 for a two-tailed test at a 95% confidence level.
The green area represents 95% of observations, with the remaining 5% split between the two tails.
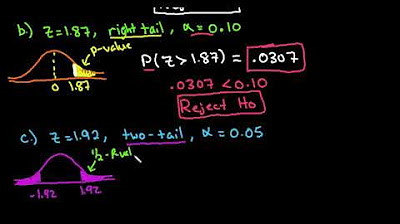
The significance of a result is determined by the p-value, which is the probability of obtaining the result by random chance.
The p-value for a z-score of 2.6 is less than 0.025, indicating a significant result.
The exact p-value can be calculated or looked up in a normalized table of z-scores and probabilities.
The video provides a link to another resource that explains how to calculate or find p-values in more detail.
The concept of alpha divided by two is explained in the context of two-tailed tests and its use in equations like confidence intervals.
The video emphasizes that both stating 'P is equal to 0.0047' and 'P is less than 0.025' are correct ways to express p-values.
The importance of understanding the requirements of professors or journals when reporting p-values is highlighted.
The video encourages viewers to watch related videos for a deeper understanding of statistical concepts.
The presenter shares links to related videos for further learning and understanding.
The video concludes with a call to action for viewers to share the knowledge, like, subscribe, and engage with the content.
Transcripts
Browse More Related Video


5.0 / 5 (0 votes)
Thanks for rating: