How To Graph Polar Equations
TLDRThe video script offers a comprehensive guide on graphing polar equations, focusing on circles, limassons (limaçons), and rose curves. It explains how to plot circles using equations like r = a cos(θ) and r = a sin(θ), where 'a' determines the circle's diameter and position relative to the polar axis. The script then delves into limassons, illustrating how the sign and values of 'a' and 'b' in the equation r = a ± b sin(θ) or r = a ± b cos(θ) affect the shape and orientation of these curves. Four types of limassons are covered: those with an inner loop, the heart-shaped cardioid, the dimpled version without an inner loop, and those resembling a circle. The process for graphing each type is outlined, emphasizing the importance of identifying key points like intercepts. The script concludes with practical examples, demonstrating how to apply these principles to plot various polar equations, providing viewers with a clear understanding of polar graphing techniques.
Takeaways
- 📏 Circles: The equation r = a cos(θ) describes a circle centered on the x-axis. If a is positive, the circle opens to the right; if a is negative, it opens to the left.
- 📐 Diameter and Radius: The value of a represents the diameter of the circle, and half of a (a/2) is the radius.
- 🔍 Example: For r = 4 cos(θ), the circle has a diameter of 4 and a radius of 2, centered on the x-axis.
- 🌐 Sine Circles: The equation r = a sin(θ) describes a circle centered on the y-axis. Positive a opens above the x-axis, and negative a opens below.
- ✏️ Sine Example: For r = 2 sin(θ), the circle has a diameter of 2 and a radius of 1, centered on the y-axis.
- 🔄 Limacons: The equation r = a ± b cos(θ) or r = a ± b sin(θ) describes limacons. Positive cosine opens to the right, negative to the left. Positive sine opens upward, negative downward.
- 🔂 Types of Limacons: If a/b < 1, it has an inner loop. If a/b = 1, it's a cardioid (heart-shaped). If 1 < a/b < 2, it has a dimple. If a/b ≥ 2, it looks almost like a circle without a dimple or inner loop.
- 📈 Example with Inner Loop: For r = 3 + 5 cos(θ), a/b < 1, so it's a limacon with an inner loop, opening to the right.
- 🧮 Cardioid: For r = 3 + 3 cos(θ), since a = b, it's a cardioid, a heart-shaped curve opening to the right.
- 🔀 Adjusting Limacons: For negative cosine or sine in limacon equations, the shape opens in the opposite direction (left for negative cosine, down for negative sine).
Q & A
What is the basic form of a polar equation for a circle?
-The basic form of a polar equation for a circle is r = a * cos(θ) or r = a * sin(θ), where 'a' represents the diameter of the circle.
How does the sign of 'a' in the polar equation r = a * cos(θ) affect the orientation of the circle?
-If 'a' is positive, the circle is directed towards the right. If 'a' is negative, the circle is directed towards the left.
What is the significance of 'a' in the polar equation r = a * cos(θ) when graphing a circle?
-'a' represents the diameter of the circle, and half of 'a' is the radius from the center to any point on the circle.
Can you provide an example of graphing a circle with the polar equation r = 4 * cos(θ)?
-To graph r = 4 * cos(θ), you would start at the origin, travel 4 units to the right (since 'a' is 4), and then up and down 2 units (half of 'a') to form the circle.
What happens when the polar equation is r = a * sin(θ) and 'a' is positive?
-When 'a' is positive in the equation r = a * sin(θ), the circle is centered on the y-axis and goes above the x-axis.
How does the orientation of the circle change when 'a' is negative in the polar equation r = a * sin(θ)?
-If 'a' is negative in r = a * sin(θ), the circle is still centered on the y-axis but opens in the negative y direction, below the x-axis.
What is a limaçon and what is its general polar equation form?
-A limaçon is a type of polar curve with the general equation form r = a ± b * sin(θ) or r = a ± b * cos(θ), where 'a' and 'b' are constants.
What are the different shapes of limaçons based on the ratio of 'a' to 'b'?
-Limaçons can have shapes with an inner loop, no inner loop, a heart shape (cardioid), or a dimpled shape without an inner loop, depending on whether the ratio of 'a' to 'b' is less than one, equal to one, between one and two, or greater than or equal to two.
How do you determine the direction in which a limaçon opens based on its equation?
-A limaçon opens towards the positive y-axis if the equation has a plus sign and towards the negative y-axis if it has a minus sign. For cosine, it opens towards the positive x-axis with a plus and towards the negative x-axis with a minus.
Can you give an example of graphing a limaçon with the equation r = 3 + 5 * cos(θ)?
-To graph r = 3 + 5 * cos(θ), first identify 'a' as 3 and 'b' as 5. Since a/b (3/5) is less than one, it has an inner loop. Plot the y-intercepts at 3 and -3, the x-intercepts at 2 (b-a) and 8 (a+b), and sketch the limaçon shape accordingly.
What is the cardioid and how can you graph it?
-The cardioid is a heart-shaped limaçon that occurs when 'a' equals 'b' in the equation r = a ± b * cos(θ). To graph it, plot the y-intercepts at 'a' and -'a', and the x-intercepts at the origin and 'a' + 'b'.
Outlines
📐 Introduction to Graphing Polar Equations
This paragraph introduces the topic of graphing polar equations, specifically focusing on circles, limassons, rose curves, and limaçons. It explains the first type of polar equation for a circle, r = a*cosine(theta), and how the value of 'a' determines the direction and size of the circle. The paragraph provides examples of graphing circles using this equation, including r = 4*cosine(theta) and r = -6*sine(theta), and explains how to find the center and radius of the circle.
📐 Graphing Circles with Sine and Cosine
This paragraph continues the discussion on graphing circles using polar equations. It explains the second type of polar equation for a circle, r = a*sine(theta), and how sine is associated with the y-axis. The paragraph provides examples of graphing circles using this equation, including r = 2*sine(theta) and r = -8*sine(theta), and explains how to find the center and radius of the circle. It also discusses how to find the area of the circle using the radius.
📐 Understanding and Graphing Limaçons
This paragraph introduces the concept of limaçons, which are a type of polar graph. It explains the general equation for a limaçon, r = a ± b*sine(theta) or r = a ± b*cosine(theta), and how the signs of 'a' and 'b' determine the direction and shape of the graph. The paragraph describes the four different shapes of limaçons based on the ratio of 'a' to 'b': inner loop, heart-shaped (cardioid), dimpled with no inner loop, and almost circular. It provides examples of graphing limaçons using different equations.
📐 Graphing Specific Limaçon Equations
This paragraph provides detailed steps for graphing specific limaçon equations, focusing on finding key points such as intercepts. It explains how to identify the type of limaçon (inner loop or outer loop) based on the ratio of 'a' to 'b' and the sign of the equation. The paragraph provides examples of graphing limaçons with equations like r = 3 + 5*cosine(theta), r = 2 - 5*sine(theta), r = 3 - 7*cosine(theta), and r = 3 + 3*cosine(theta). It emphasizes finding the y-intercepts, x-intercepts, and sketching the general shape of the limaçon.
📐 Graphing the Heart-Shaped Limaçon (Cardioid)
This final paragraph focuses on graphing the heart-shaped limaçon, also known as the cardioid. It explains that when 'a' equals 'b' in the limaçon equation, the graph takes the shape of a cardioid. The paragraph provides an example of graphing a cardioid with the equation r = 3 + 3*cosine(theta). It describes the general shape of the cardioid and how to find the x and y intercepts, and provides a step-by-step guide to sketching the cardioid graph.
Mindmap
Keywords
💡Polar Equations
💡Circle
💡Limaçon
💡Rose Curves
💡Cosine Theta
💡Sine Theta
💡Graphing
💡Diameter
💡Radius
💡Area of the Circle
💡Cardioid
Highlights
Introduction to graphing polar equations including circles, limaçons, roses, curves, and lemniscates.
Explanation of the polar equation r = a cosine theta for graphing circles, with 'a' representing the diameter.
Demonstration of how to graph a circle with the equation r = 4 cosine theta, including finding the center and radius.
Illustration of graphing a circle with a negative 'a' value, showing the circle's orientation to the left.
Method for finding the area of a circle using the formula pi * r squared, where 'r' is the radius.
Transition to graphing limaçons with the equation r = a plus or minus b sine theta, and variations based on the sign and values of 'a' and 'b'.
Description of the general shape of a limaçon with an inner loop when a/b < 1.
Introduction of the heart-shaped limaçon, or cardioid, which occurs when a/b = 1.
Explanation of the dimpled limaçon without an inner loop for the case when a/b is between 1 and 2.
Presentation of the limaçon shape without a dimple or inner loop for a/b ≥ 2, resembling a circle.
Step-by-step guide on graphing the limaçon equation r = 3 plus 5 cosine theta, including identifying a and b, and plotting intercepts.
Graphing example of r = 2 minus 5 sine theta, with emphasis on the direction and intercepts due to the negative sign.
Demonstration of graphing r = 3 minus 7 cosine theta, focusing on the leftward orientation and x-intercepts.
Guide to graphing the heart-shaped limaçon with r = 3 plus 3 cosine theta, detailing the absence of an inner loop and intercepts.
Emphasis on the importance of identifying the correct intercepts and direction for accurate graphing of polar equations.
Transcripts
Browse More Related Video
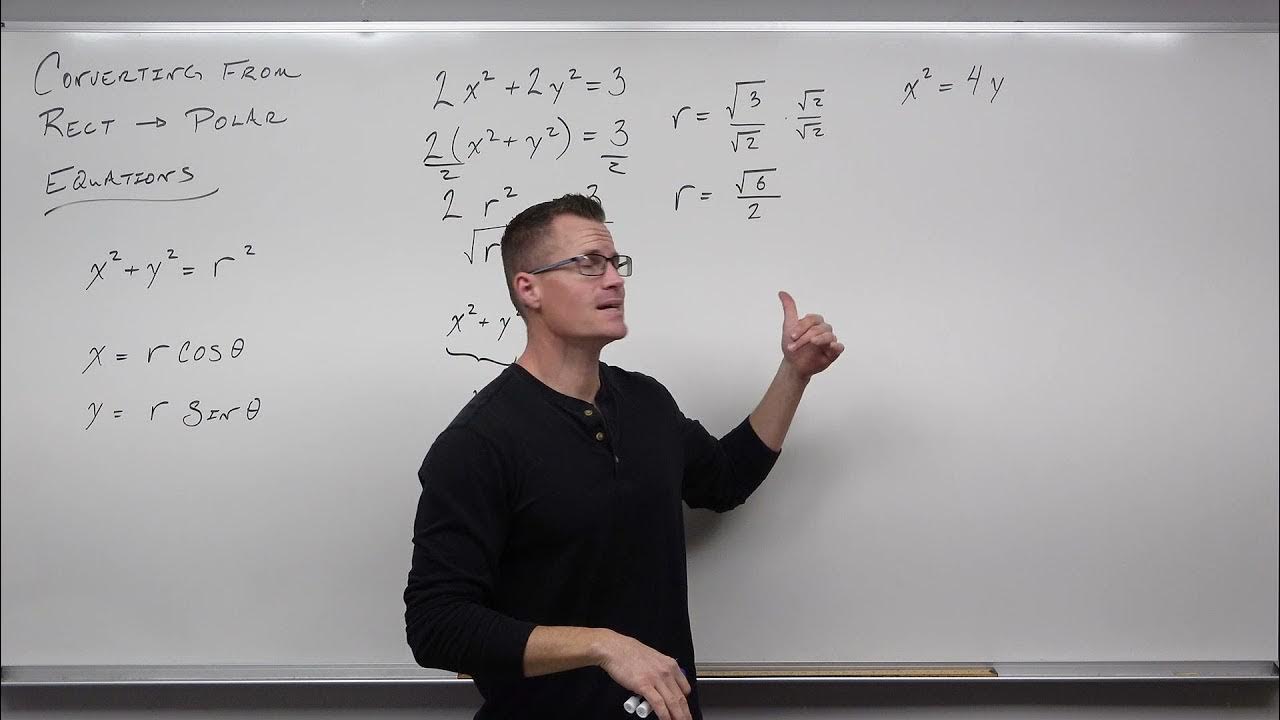
How to Convert From Rectangular Equations to Polar Equations (Precalculus - Trigonometry 39)
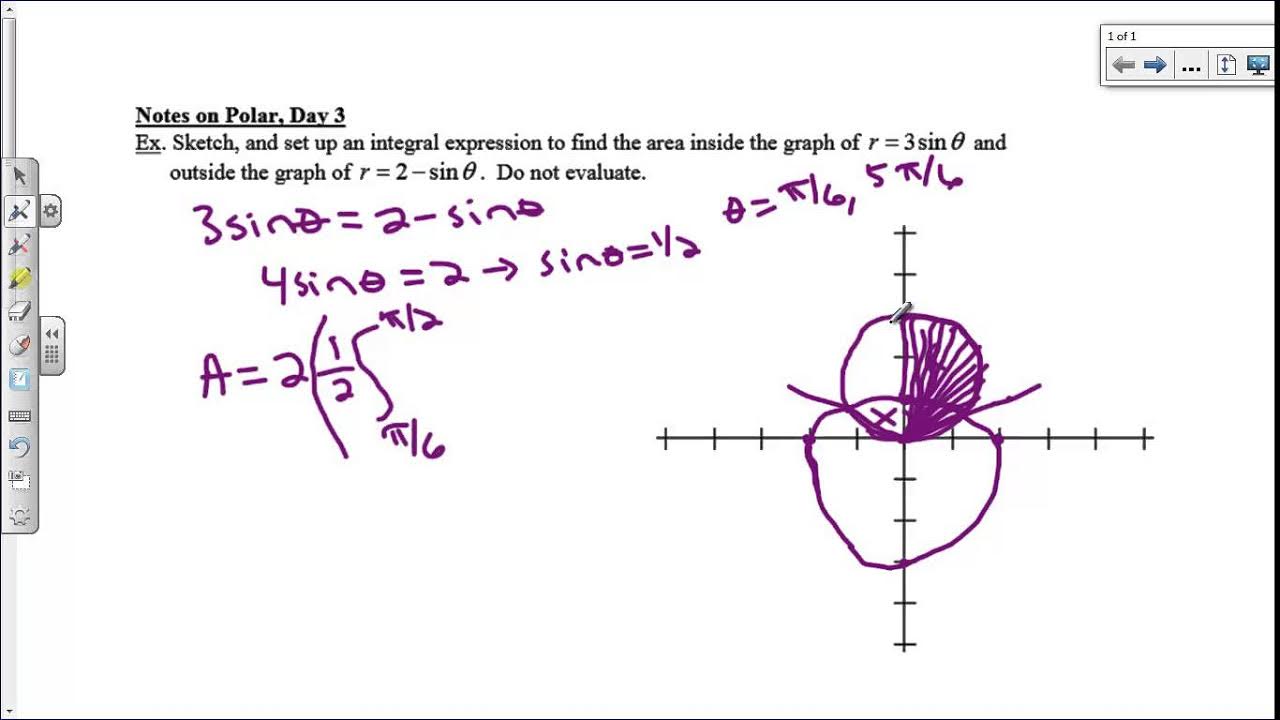
Notes on Polar, Day 3
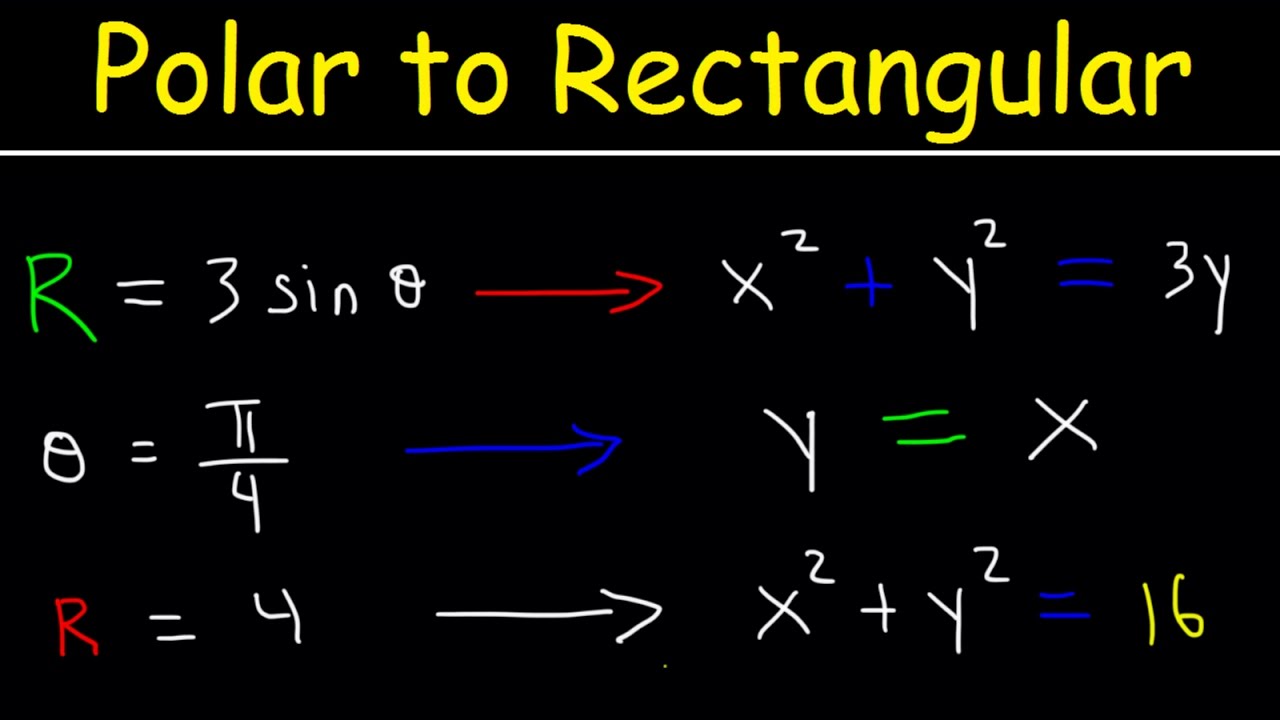
Polar Equations to Rectangular Equations, Precalculus, Examples and Practice Problems

Polar coordinates 3 | Parametric equations and polar coordinates | Precalculus | Khan Academy
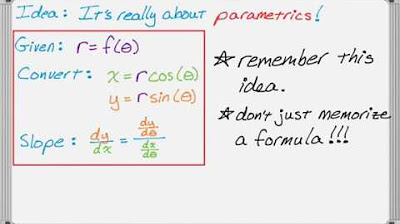
Finding Slope of a Polar Curve in Calculus
How to Convert From Polar Coordinates to Rectangular Coordinates (Precalculus - Trigonometry 37)
5.0 / 5 (0 votes)
Thanks for rating: