Introduction to the normal distribution | Probability and Statistics | Khan Academy
TLDRThis video script delves into the significance of the normal distribution in statistics, highlighting its foundational role in inferential statistics. The instructor aims to provide a comprehensive understanding of the normal distribution, enabling viewers to recognize and apply it effectively. The script introduces the normal distribution formula, explains its components, including mean and standard deviation, and discusses the probability density function. It also touches on the central limit theorem, illustrating how the normal distribution emerges from the sum of many independent trials. Practical applications are demonstrated through an interactive spreadsheet, which allows viewers to manipulate parameters and visualize changes in the distribution curve. The video concludes by emphasizing the importance of the normal distribution in various real-world scenarios and encourages further exploration of its properties.
Takeaways
- 📚 The normal distribution is a fundamental concept in statistics, crucial for inferential statistics which involve making inferences based on data points.
- 📈 The video and accompanying spreadsheet aim to provide a deep understanding of the normal distribution, enabling viewers to recognize and use it effectively.
- 🔍 The normal distribution is represented by a probability density function, characterized by Greek letters such as sigma for standard deviation.
- 📉 In a continuous probability distribution, probabilities are determined by the area under the curve, unlike discrete distributions like the binomial.
- 🧩 The probability in a normal distribution is found by integrating the probability density function over a specified range, often done numerically due to complexity.
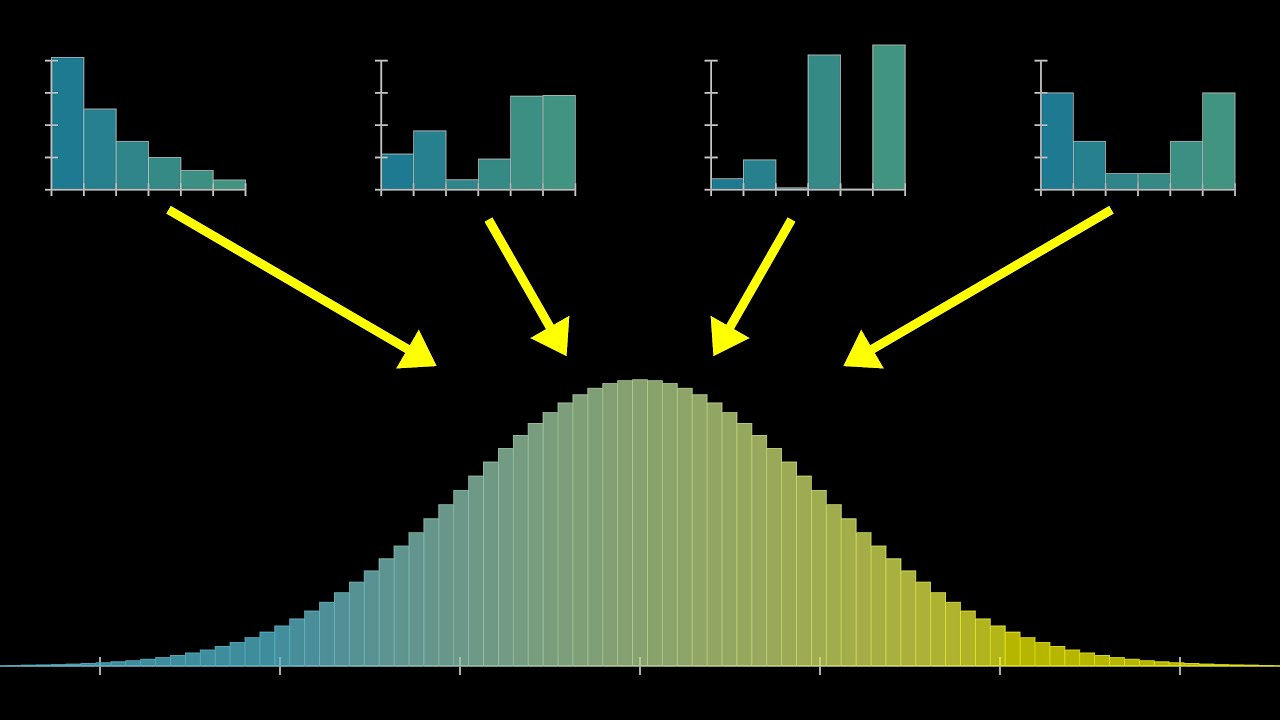
- 🌐 The normal distribution is connected to the central limit theorem, which states that the sum of many independent trials tends to form a normal distribution, regardless of the original distribution of the trials.
- 📊 The spreadsheet allows for manipulation of the mean and standard deviation to visualize how these parameters affect the shape and position of the normal distribution curve.
- 📝 The formula for the normal distribution involves e (Euler's number), pi, and the variance, and can be rewritten in various forms to provide different insights.
- 📉 The mean and standard deviation are key in determining the location and spread of the normal distribution curve, respectively.
- 🤔 The video encourages viewers to explore the spreadsheet and the normal distribution formula to gain an intuitive understanding of its properties and applications.
- 🔮 Cumulative distribution functions are essential for calculating probabilities in a normal distribution, providing the area under the curve up to a certain point.
Q & A
What is the significance of the normal distribution in statistics?
-The normal distribution is arguably the most important concept in statistics because it underlies much of inferential statistics, which involves making inferences based on data points.
Where can I find the spreadsheet mentioned in the script for a deeper understanding of the normal distribution?
-The spreadsheet can be downloaded from www.khanacademy.org/downlads/ by typing in the URL and downloading the file named 'normalintro.xls'.
What is the role of sigma in the normal distribution formula?
-Sigma (σ) represents the standard deviation of the normal distribution, which is a measure of the dispersion or spread of the data points around the mean.
How does the normal distribution differ from a discrete distribution like the binomial?
-The normal distribution is a continuous probability distribution, meaning it deals with ranges of values and the probability is given by the area under the curve. In contrast, the binomial distribution is discrete and gives probabilities for specific outcomes.
Can you explain the concept of a probability density function in the context of the normal distribution?
-A probability density function (PDF) for a continuous distribution like the normal distribution describes the likelihood of the data falling within a particular range of values. The probability is calculated as the area under the curve within that range, not at a single point.
What is the central limit theorem and how does it relate to the normal distribution?
-The central limit theorem states that the sum of a large number of independent trials, even if they are not normally distributed individually, will tend to form a normal distribution as the number of trials approaches infinity. This is why the normal distribution is so prevalent in nature and statistics.
How can one approximate the area under the normal distribution curve for a given range?
-The area under the normal distribution curve for a given range can be approximated numerically, often using functions that calculate the cumulative distribution function (CDF). This can also be approximated by calculating the area of a trapezoid or rectangle under the curve.
What is the meaning of the term 'z score' in the context of the normal distribution?
-The z score represents the number of standard deviations a data point is from the mean. It is used to standardize the distribution and compare data points in terms of their distance from the mean.
How does changing the mean or standard deviation of the normal distribution affect its graph?
-Changing the mean shifts the entire graph to the left or right without altering its shape. Changing the standard deviation affects the width of the graph; a larger standard deviation results in a flatter and wider curve, while a smaller standard deviation makes the curve narrower and taller.
What is the cumulative distribution function (CDF) and how is it used to find probabilities in the normal distribution?
-The cumulative distribution function (CDF) gives the probability that a normally distributed random variable is less than or equal to a certain value. It is used to find the area under the curve up to a specific point, which helps in determining probabilities for ranges of values.
Why is the normal distribution considered important for modeling complex phenomena in nature?
-The normal distribution is important for modeling complex phenomena because it often emerges as the result of the sum of many independent trials or interactions, even if the individual outcomes are not normally distributed. This makes it a versatile tool for statistical analysis in various fields.
How can one determine the probability of a specific range of outcomes in a normal distribution?
-To determine the probability of a specific range of outcomes, one would calculate the cumulative distribution function (CDF) at the upper and lower bounds of the range and then subtract the CDF value at the lower bound from that at the upper bound, yielding the probability of the range.
Outlines
📚 Introduction to the Importance of Normal Distribution
The script begins by emphasizing the significance of the normal distribution in statistics, particularly in inferential statistics where conclusions are drawn from data points. The speaker aims to provide a deep understanding of the normal distribution through a downloadable spreadsheet from Khan Academy. The spreadsheet is designed to help viewers recognize and apply the normal distribution formula throughout their lives. The script also references Wikipedia for the probability density function of the normal distribution and introduces the concept of standard deviation within this context.
📉 Understanding the Normal Distribution and Continuous Probability
This paragraph delves into the specifics of the normal distribution as a continuous probability density function, contrasting it with the discrete nature of the binomial distribution. It explains the concept of probability in a continuous distribution, where probabilities are calculated over a range of values rather than at a single point. The script introduces the method of calculating probabilities using the area under the curve, which is done numerically due to the complexity of the integral involved. The central limit theorem is highlighted as a key principle, demonstrating how the sum of many independent trials tends to form a normal distribution regardless of the original distribution of the trials.
🔍 Exploring the Formula and Characteristics of the Normal Distribution
The script provides a detailed look at the formula of the normal distribution, breaking down the components such as the mean, standard deviation, and variance. It offers insights into how to use the formula to determine the height of the distribution at a given point and how to calculate probabilities over a range. The explanation includes the concept of the z-score, which measures the distance from the mean in terms of standard deviations. The speaker encourages viewers to explore different forms of the formula to gain intuition and understanding.
📊 Visualizing Changes in the Normal Distribution with Spreadsheet
The speaker discusses the use of a spreadsheet to visualize the normal distribution, allowing for adjustments to the mean and standard deviation to see how the distribution changes. The script describes how shifting the mean slides the distribution along the horizontal axis and how altering the standard deviation affects the width of the distribution curve. It also touches on the infinite range of the normal distribution compared to the finite range of the binomial distribution and the concept of calculating probabilities as areas under the curve.
📈 The Cumulative Distribution Function and Probability Calculations
This paragraph introduces the concept of the cumulative distribution function (CDF), which provides the area under the normal distribution curve up to a certain point. The script explains how the CDF can be used to calculate probabilities for ranges of values by subtracting the CDF values at the lower and upper bounds of the range. It demonstrates the use of Excel functions to perform these calculations and emphasizes the importance of understanding the CDF in relation to the normal distribution.
📐 Practical Application and Manipulation of the Normal Distribution
The speaker provides a practical demonstration of how to use the normal distribution in a spreadsheet, showing how to plot the distribution and calculate probabilities for different ranges. The script explains the process of evaluating the cumulative distribution function at specific points and subtracting these values to find the probability of a range. It also discusses the concept of standard deviations in relation to the mean and the common probability of falling within one standard deviation of the mean in a normal distribution.
🔧 Conclusion and Encouragement to Explore the Normal Distribution
The final paragraph wraps up the discussion by encouraging viewers to experiment with the spreadsheet and gain an intuitive understanding of the normal distribution. The script highlights the importance of the normal distribution in various fields and suggests that viewers create their own spreadsheets for further exploration. It also hints at future applications of the normal distribution in modeling, such as financial forecasting.
Mindmap
Keywords
💡Normal Distribution
💡Inferential Statistics
💡Standard Deviation
💡Probability Density Function (PDF)
💡Continuous Probability Distribution
💡Central Limit Theorem
💡Cumulative Distribution Function (CDF)
💡Variance
💡Z-Score
💡Spreadsheet
Highlights
The normal distribution is a fundamental concept in statistics, essential for inferential statistics based on data points.
The video and spreadsheet aim to provide a deep understanding of the normal distribution for lifelong application.
The normal distribution spreadsheet is downloadable from www.khanacademy.org/downloads/ for further exploration.
The normal distribution is represented with Greek letters, including sigma for standard deviation, on Wikipedia.
Understanding standard deviation in the context of a probability density function is crucial for grasping the normal distribution.
Continuous probability distributions require calculating probabilities over a range, unlike discrete distributions.
The probability in a normal distribution is found by the area under the curve, often calculated numerically due to complexity.
The central limit theorem is highlighted, showing that the sum of many independent trials approaches a normal distribution.
The normal distribution is applicable even when individual trials do not follow a normal distribution themselves.
The importance of the normal distribution in nature and inferential statistics is emphasized for its prevalence and utility.
The formula for the normal distribution is dissected to understand its components, including mean, variance, and standard deviation.
The concept of z-scores is introduced as a measure of how many standard deviations away from the mean a point is.
Excel functions are used to demonstrate how to calculate probabilities and manipulate the normal distribution curve.
The impact of changing the mean and standard deviation on the shape and position of the normal distribution curve is shown.
The difference between discrete and continuous distributions is clarified through the properties of the normal distribution.
The cumulative distribution function is explained as a tool for finding the area under the normal distribution curve up to a certain point.
The spreadsheet demonstrates calculating probabilities between two points by subtracting cumulative distribution function values.
The 68.3 percent rule is discussed, stating that under a normal distribution, there's a 68.3 percent chance of landing within one standard deviation of the mean.
The integral over the entire normal distribution curve must equal 1, representing all possible outcomes.
The video encourages viewers to experiment with the spreadsheet to gain an intuitive understanding of the normal distribution.
Transcripts
Browse More Related Video
But what is the Central Limit Theorem?
Types Of Distribution In Statistics | Probability Distribution Explained | Statistics | Simplilearn

Elementary Statistics - Chapter 6 Normal Probability Distributions Part 1
Lecture 14: Location, Scale, and LOTUS | Statistics 110
The Normal Distribution and the 68-95-99.7 Rule (5.2)
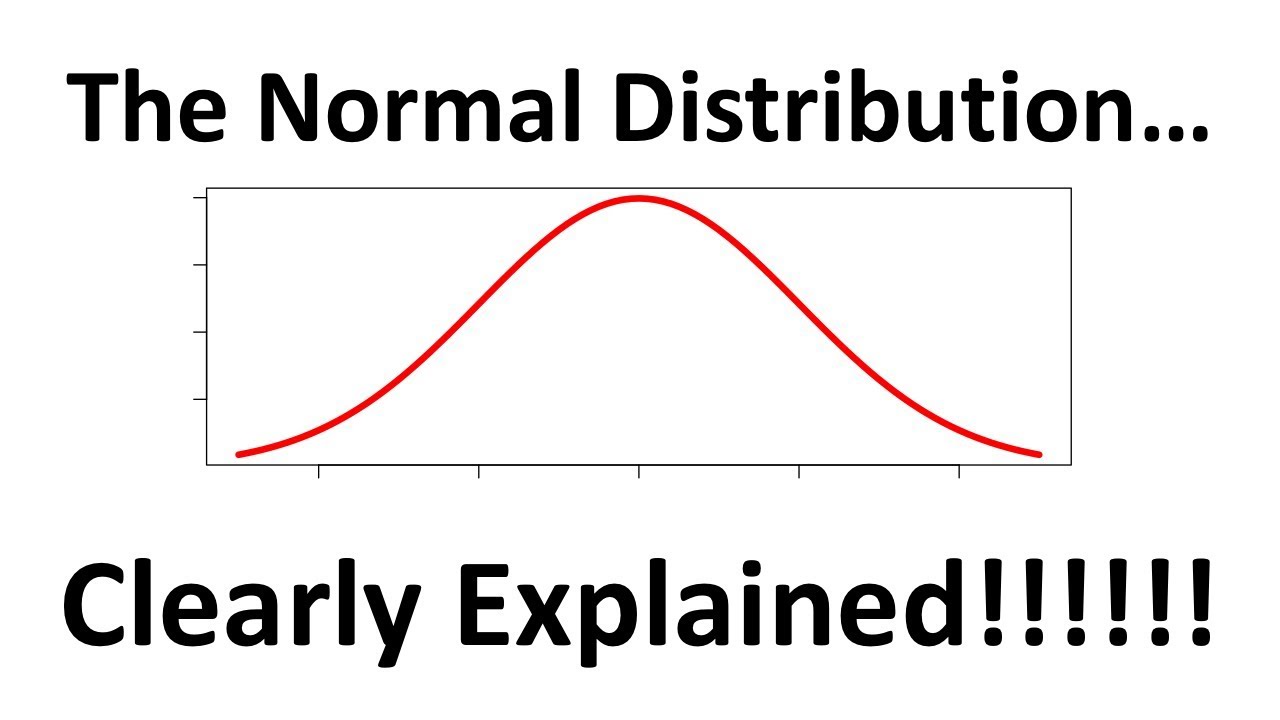
The Normal Distribution, Clearly Explained!!!
5.0 / 5 (0 votes)
Thanks for rating: