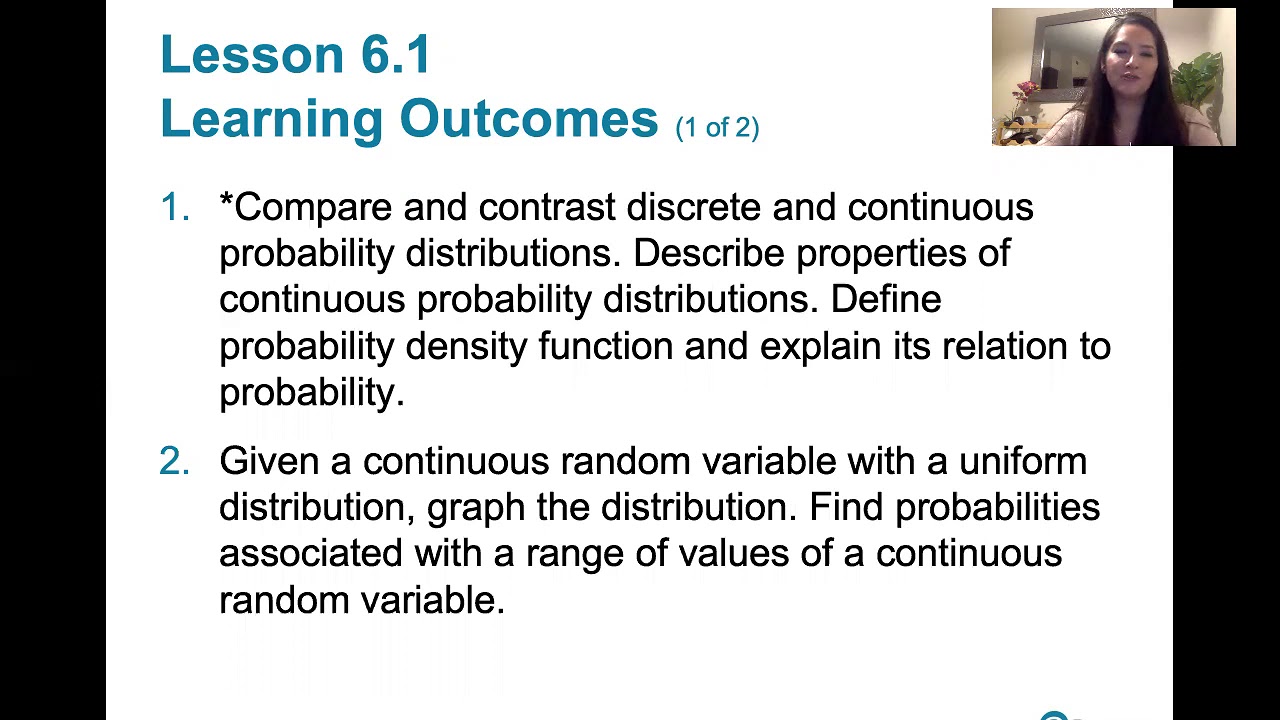
6.1.3 The Standard Normal Distribution - Normal Dist. and Properties of the Standard Normal Dist.
TLDRThis video introduces the concept of normal distributions, focusing on the standard normal distribution. It explains that a normal distribution is symmetric and bell-shaped, centered around the mean (μ) with a standard deviation (σ). The video clarifies that while the probability density function defines the distribution, it won't be used in the class; instead, z-scores and tables will be utilized to find probabilities and ranges. The standard normal distribution, with a mean of zero and a standard deviation of one, is highlighted, setting the stage for further exploration of z-scores and their corresponding probabilities in upcoming lessons.
Takeaways
- 📚 The video introduces the concept of normal distributions, a fundamental topic in statistics.
- 📈 Normal distributions are characterized by a symmetric, bell-shaped graph centered around the mean.
- 📝 The probability density function (PDF) of a normal distribution is defined by the population mean (mu) and standard deviation (sigma).
- 🔍 The video emphasizes that while the PDF formula is presented, it will not be used in the class, focusing instead on the relationship between areas under the curve and probabilities.
- 📊 The total area under the normal distribution curve equals 1, reflecting the total probability of all possible outcomes.
- 🌐 Normal distributions can vary widely, each defined by different means and standard deviations, but all sharing the same bell-shaped form.
- 🧠 Examples given include IQ scores with a mean of 100 and a standard deviation of 15, and SAT scores with a mean of 500 and a standard deviation of 100.
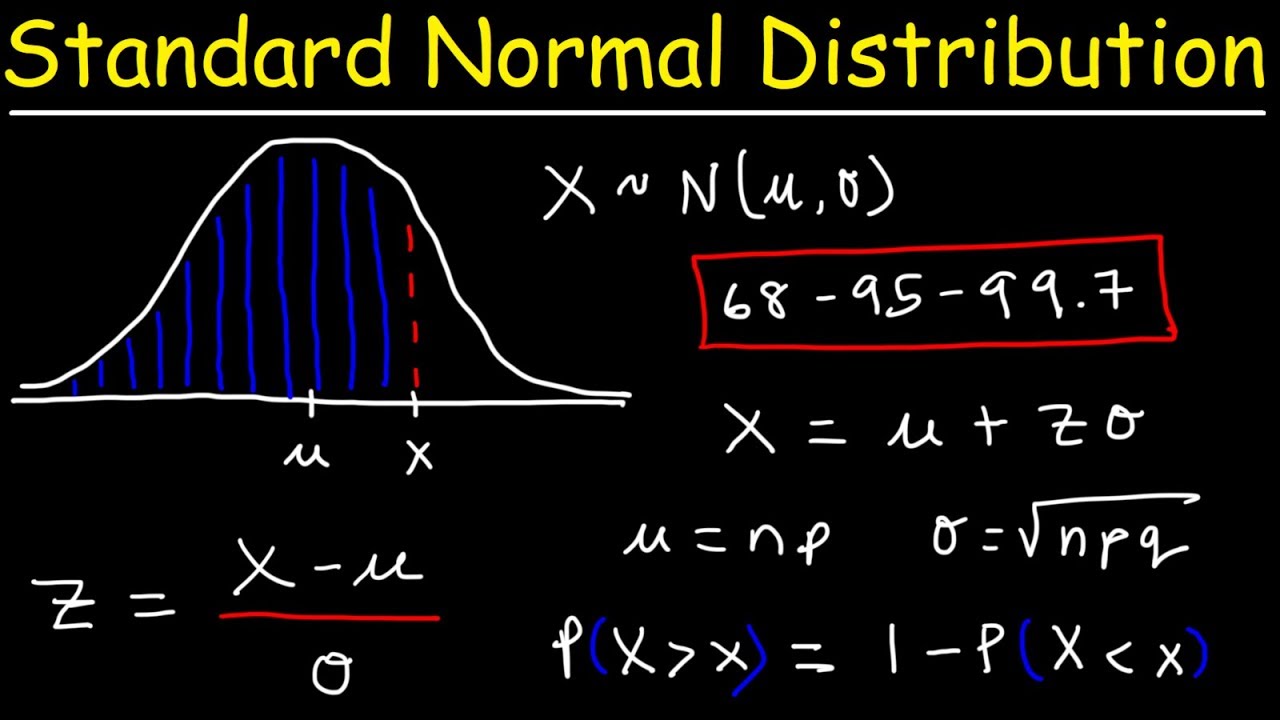
- 🌟 The standard normal distribution is a special case with a mean of 0 and a standard deviation of 1, often used as a reference for other normal distributions.
- 🔢 Z-scores are introduced as a measure of how many standard deviations a value is from the mean, with positive indicating above the mean and negative below.
- 📚 The next learning outcomes will involve finding probabilities for given ranges of z-scores and vice versa, using a table of z-scores.
- 🔑 The video concludes by setting the stage for future lessons on relating areas under the normal distribution curve to z-scores and probabilities.
Q & A
What is a normal distribution in the context of the video script?
-A normal distribution is a type of continuous probability distribution characterized by a symmetric, bell-shaped graph. It is represented by a probability density function that is dependent on the population mean (μ) and the population standard deviation (σ).
What is the significance of the mean (μ) and standard deviation (σ) in a normal distribution?
-The mean (μ) is the center of the distribution and represents the average value of the continuous random variable. The standard deviation (σ) measures the dispersion of the values around the mean, indicating how spread out the data is.
Why is the normal distribution considered important in statistics?
-The normal distribution is arguably the most important type of continuous probability distribution due to its prevalence in various natural and social phenomena. It provides a good model for many real-world data sets and is fundamental in statistical inference and hypothesis testing.
What is the standard normal distribution as discussed in the video script?
-The standard normal distribution is a special case of the normal distribution with a mean of zero and a standard deviation of one. It serves as a reference distribution from which other normal distributions can be compared or converted.
What are z-scores and how do they relate to the standard normal distribution?
-Z-scores represent the number of standard deviations a value is above or below the mean. In the context of the standard normal distribution, they are used to measure the position of a value along the horizontal axis, with the mean set to zero.
How is the total area under the normal distribution curve related to probability?
-The total area under the normal distribution curve is equal to 1, which corresponds to a probability of 100%. This area represents the certainty that a continuous random variable will fall within the range of all possible values.
What is the purpose of looking up z-scores in a table?
-Z-scores tables are used to find the probabilities associated with different ranges of a continuous random variable in a normal distribution. They allow us to determine the likelihood of a variable falling within a specific interval without performing complex calculus.
Why is calculus not used in the class to find areas under the normal distribution curve?
-Although calculus can be used to find the exact areas under the curve, the class focuses on using z-scores and tables to find probabilities and ranges for continuous random variables, which is a more practical approach for many statistical applications.
Can you provide an example of a real-world application of the normal distribution mentioned in the video script?
-Yes, IQ scores and SAT scores are examples mentioned in the script. Both have means and standard deviations, and their distributions can be modeled using the normal distribution to understand the spread and likelihood of different scores.
What is the relationship between the normal distribution and the probability density function (PDF)?
-The probability density function (PDF) is the mathematical function that describes the normal distribution. It assigns a probability per change in x to every x value that the continuous random variable may take on, and the shape of the PDF is the bell curve associated with the normal distribution.
How do different normal distributions differ from one another?
-Different normal distributions differ in their means (μ) and standard deviations (σ). While the shape of the bell curve remains the same, the location and spread of the data change according to these parameters.
Outlines
📚 Introduction to Normal Distributions
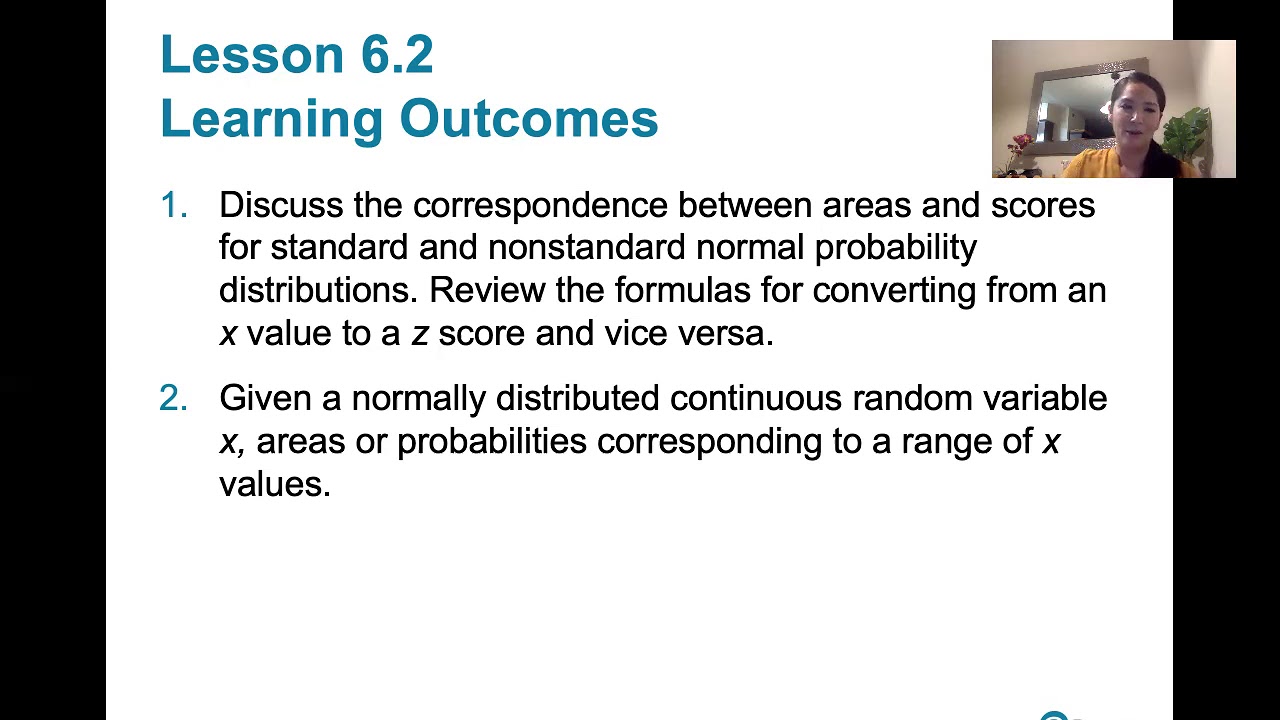
This paragraph introduces learning outcome number three from lesson 6.2, focusing on normal distributions and their properties. It explains that a normal distribution is characterized by a symmetric, bell-shaped graph and is defined by a probability density function that depends on the population mean (mu) and standard deviation (sigma). The paragraph clarifies that while the function is associated with the normal distribution, it will not be used in the class; instead, the focus will be on using z-scores and tables to find probabilities and ranges for continuous random variables. It also mentions that different variables can have different means and standard deviations but still follow the normal distribution pattern, exemplified by IQ scores and SAT scores.
📉 Understanding the Standard Normal Distribution and Z-Scores
The second paragraph delves into the concept of the standard normal distribution, which is a special case of the normal distribution with a mean of zero and a standard deviation of one. It explains the significance of z-scores, which represent the number of standard deviations a value is from the mean, and how they are used to list values on the horizontal axis of the standard normal distribution graph. The paragraph emphasizes that areas under the curve for different z-scores correspond to probabilities, setting the stage for the next learning outcomes where the relationship between z-scores and probabilities will be explored, including finding probabilities for a range of z-scores and determining z-scores for given probabilities.
Mindmap
Keywords
💡Normal Distribution
💡Standard Normal Distribution
💡Continuous Random Variable
💡Probability Density Function (PDF)
💡Symmetric
💡Mean (μ)
💡Standard Deviation (σ)
💡Z-Score
💡Area Under the Curve
💡Calculus
💡IQ Score and SAT Score
Highlights
Introduction to the concept of a normal distribution.
Explanation of normal distribution as a symmetric, bell-shaped graph.
Definition of a normal distribution using the probability density function.
Importance of the population mean (mu) and standard deviation (sigma) in the normal distribution function.
Clarification that calculus is not required to understand normal distributions in this class.
Introduction of the correspondence between areas under the curve and probabilities.
Use of z-scores table for finding probabilities and ranges of a continuous random variable.
Differentiation between various normal distributions by their means and standard deviations.
Example of IQ scores and SAT scores as applications of normal distribution.
Description of the standard normal distribution with a mean of zero and a standard deviation of one.
Explanation of z-scores as the number of standard deviations from the mean.
Total area under the standard normal distribution curve equals one.
Relating areas under the curve to probabilities for different ranges of z-scores.
Upcoming learning outcomes involving finding areas or probabilities for given z-score ranges.
Introduction of the reverse task: given areas or probabilities, find the corresponding z-scores.
Anticipation of the next video for further exploration of these concepts.
Transcripts
Browse More Related Video

Elementary Statistics - Chapter 6 Normal Probability Distributions Part 1
6.1.0 The Standard Normal Distribution - Lesson Overview, Learning Outcomes
Standard Normal Distribution Tables, Z Scores, Probability & Empirical Rule - Stats
6.2.0 Nonstandard Normal Distributions - Lesson Overview, Learning Outcomes, Key Concepts
ck12.org normal distribution problems: z-score | Probability and Statistics | Khan Academy

Elementary Stats Lesson #11
5.0 / 5 (0 votes)
Thanks for rating: