6.1.0 The Standard Normal Distribution - Lesson Overview, Learning Outcomes
TLDRThis video lesson introduces Lesson 6.1 on the standard normal distribution, emphasizing the importance of understanding continuous probability distributions. It aims to help viewers compare discrete and continuous distributions, define probability density functions, and grasp the concept of probabilities represented by areas under the curve. The focus is on the standard normal distribution's properties, including its bell shape, mean of zero, and standard deviation of one. The lesson's goal is to enable students to find probabilities for z-scores and vice versa, as well as to relate percentiles, areas, and identify critical values.
Takeaways
- 📚 The video discusses Lesson 6.1 from 'Essentials of Statistics' by Mario Triola, focusing on the standard normal distribution.
- 📈 The lesson is divided into four sections, each covering different aspects of normal probability distributions.
- 📉 The first learning outcome is to compare discrete and continuous probability distributions and understand their properties.
- 📊 The second learning outcome involves understanding and graphing uniform distributions and calculating probabilities within a range.
- 📝 The third learning outcome is to describe the properties of the standard normal distribution, which is bell-shaped, symmetric, with a mean of zero and a standard deviation of one.
- 🔍 The fourth learning outcome is to find areas or probabilities corresponding to a range of z-scores in the standard normal distribution.
- 🔢 The fifth learning outcome is the reverse process of the fourth, finding a range of z-scores associated with known areas or probabilities.
- 🌐 The importance of understanding the relationship between probability density functions and probabilities is emphasized.
- 📊 Areas under the probability density curve represent probabilities for a range of values of a continuous random variable.
- 🔑 Key concepts include the understanding that continuous random variables are associated with probability density functions or curves.
- 📚 The course will focus on three continuous probability distributions, starting with the uniform distribution, then general normal distributions, and finally the standard normal distribution.
Q & A
What is the main topic of Lesson 6.1 in the video?
-The main topic of Lesson 6.1 is the standard normal distribution.
What are the four sections that will be covered in Chapter 6 of 'Essentials of Statistics' by Mario Triola?
-Chapter 6 covers normal probability distributions, starting with continuous probability distributions, and then focusing on the standard normal distribution, uniform distributions, and finding probabilities and critical values associated with z-scores.
What is the purpose of the video script in relation to the learning outcomes?
-The purpose of the video script is to help learners understand the big picture of the concepts rather than mastering the details, focusing on comparing discrete and continuous probability distributions, describing properties of continuous distributions, and defining the probability density function.
What is a continuous probability distribution?
-A continuous probability distribution is a type of probability distribution for a continuous random variable where the variable can take any value within an interval, and probabilities are represented by areas under the probability density function curve.
What is a probability density function (PDF) and how is it related to probability?
-A probability density function is a function that describes the likelihood of a continuous random variable taking a specific value. The probability of the random variable falling within a particular range is given by the area under the PDF curve over that range.
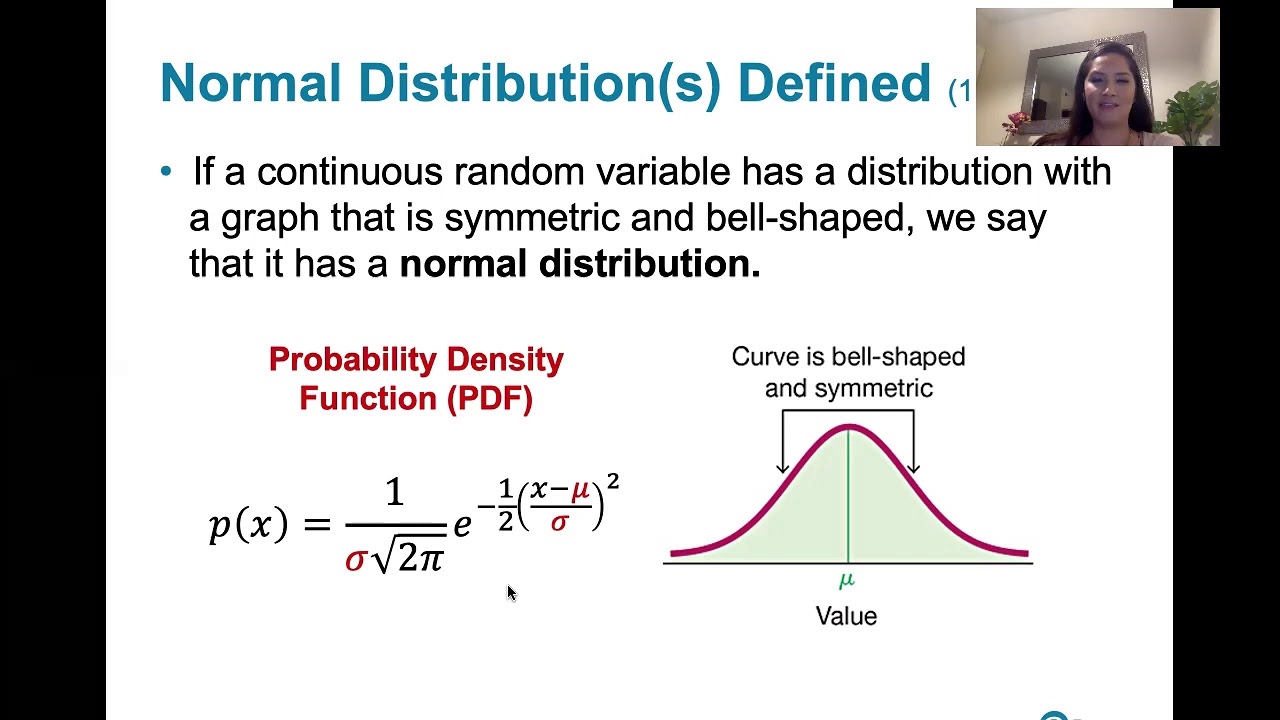
What is the significance of the standard normal distribution being bell-shaped?
-The bell-shaped form of the standard normal distribution indicates that it is symmetric, with the highest probability density at the mean and probabilities decreasing as one moves away from the mean in either direction.
What are the three properties of the standard normal distribution mentioned in the script?
-The three properties are that it is bell-shaped, symmetric, and has a mean of zero and a standard deviation of one.
What is a z-score and how is it used in the context of the standard normal distribution?
-A z-score is a measure of how many standard deviations an element is from the mean. In the context of the standard normal distribution, z-scores are used to find areas or probabilities corresponding to a range of values.
What is the relationship between percentiles and areas under the standard normal distribution curve?
-Percentiles are the values below which a given percentage of observations fall. In the standard normal distribution, percentiles correspond to specific areas under the curve, indicating the proportion of data within a certain range.
What is a critical value and how does it relate to the standard normal distribution?
-A critical value is a value of a random variable that defines the threshold for a given probability or confidence level. In the standard normal distribution, critical values are specific z-scores that correspond to these probabilities or confidence levels.
What is the goal for learners in Lesson 6.1 regarding the standard normal distribution?
-The goal is for learners to be able to describe the properties of the standard normal distribution, find areas or probabilities corresponding to a range of z-scores, and find a range of z-scores associated with known areas or probabilities.
Outlines
📚 Introduction to Lesson 6.1 on Standard Normal Distribution
This paragraph introduces Lesson 6.1, which focuses on the standard normal distribution. The video script is based on Pearson's slides, modified for the course. The lesson is part of four sections from Chapter Six of 'Essentials of Statistics' by Mario Triola, which covers normal probability distributions. The learning outcomes for this section include understanding continuous probability distributions, defining the probability density function, and explaining its relationship to probability. The instructor emphasizes the importance of grasping the big picture rather than mastering details. The key concepts involve continuous random variables, probability density functions, and the representation of probabilities through areas under the curve. The course will concentrate on three continuous probability distributions, with a special focus on the standard normal distribution, characterized by its bell shape, symmetry, mean of zero, and standard deviation of one.
Mindmap
Keywords
💡Standard Normal Distribution
💡Continuous Probability Distributions
💡Probability Density Function (PDF)
💡Uniform Distribution
💡Z-Scores
💡Areas Under the Curve
💡Bell-Shaped Curve
💡Mean
💡Standard Deviation
💡Percentiles
💡Critical Values
Highlights
Lesson 6.1 focuses on the standard normal distribution, based on Pearson slides modified for the course.
The lesson is divided into four sections covering continuous probability distributions from Chapter 6 of 'Essentials of Statistics' by Mario Triola.
Learning outcomes include comparing discrete and continuous distributions, describing properties, defining probability density function, and understanding its relationship to probability.
The goal is to understand the big picture rather than mastering the details of continuous probability distributions.
Uniform distributions will be covered, including how to graph them and find probabilities for a range of values.
Three properties of the standard normal distribution will be described: bell-shaped, symmetric, mean of zero, and standard deviation of one.
Students will learn to find areas/probabilities corresponding to a range of z-scores and vice versa.
Percentiles, areas, critical values, and the relationship between them will be defined and calculated.
Continuous random variables are associated with probability density functions or curves.
Areas under the probability density curve represent probabilities for a range of continuous random variable values.
The course will focus on three continuous probability distributions: uniform, normal in general, and the special case of the standard normal distribution.
The standard normal distribution is unique due to its specific properties and广泛应用.
Understanding the standard normal distribution enables finding probabilities and z-scores for any given range.
The lesson aims to provide a comprehensive understanding of the standard normal distribution and its applications.
The next video will discuss the first learning outcome in detail.
Transcripts
Browse More Related Video
6.2.0 Nonstandard Normal Distributions - Lesson Overview, Learning Outcomes, Key Concepts
6.1.3 The Standard Normal Distribution - Normal Dist. and Properties of the Standard Normal Dist.
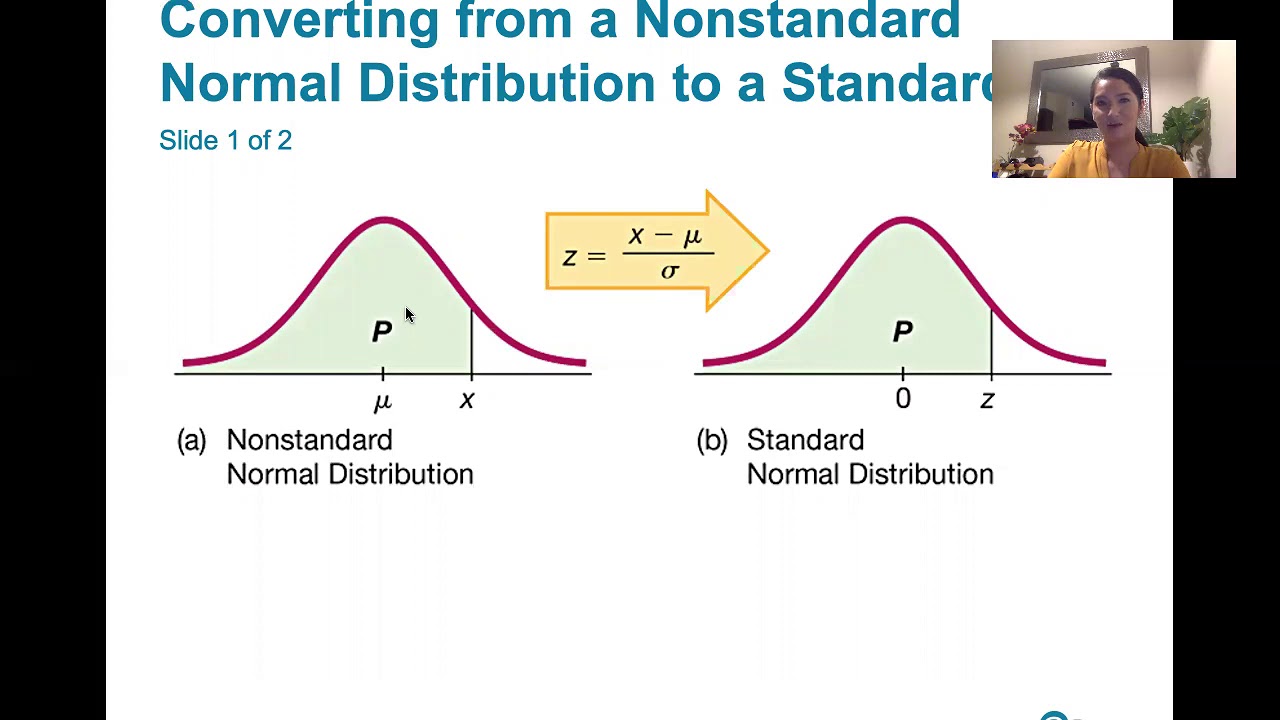
6.2.1 Nonstandard Normal Distributions -Converting B/t Standard and Nonstandard Normal Distributions

Elementary Stats Lesson #11
6.1.4 The Standard Normal Distribution - Given a range of z scores, find areas or probabilities.

Elementary Statistics - Chapter 6 Normal Probability Distributions Part 1
5.0 / 5 (0 votes)
Thanks for rating: