AP Statistics Unit 6 Summary Review Inference For Proportions Part 1 Confidence Intervals
TLDRIn this video, Michael PR provides a summary of Unit 6 on inference for categorical data with a focus on proportions. The video is divided into two parts, with part one covering confidence intervals for population proportions. Michael emphasizes the importance of understanding sample statistics and their use in making judgments about population parameters. He explains key concepts such as confidence intervals, significance tests, and the conditions required for valid inference. The video also includes detailed examples and formulas for constructing confidence intervals, aiming to prepare students for their Unit 6 test and the AP exam.
Takeaways
- 📚 The video is a summary review for Unit 6, focusing on inference for categorical data with an emphasis on proportions.
- 🔍 Inference involves using sample statistics to make judgments about population parameters, which is central to Units 6, 7, 8, and beyond.
- 📈 The script explains two main procedures in statistical inference: confidence intervals and significance tests for population proportions.
- 📝 It emphasizes the importance of having a study guide from the ultimate review packet for practice while watching the video.
- 🎯 The video is divided into two parts, with part one covering confidence intervals for population proportions and part two covering significance tests.
- 📐 Conditions for valid inference include random and independent sampling, with the sample size being less than 10% of the population and containing at least 10 successes and 10 failures.
- 🧩 The formula for a confidence interval uses the sample proportion, the critical z-score, and the standard error (referred to as 'standard air') to estimate the population proportion.
- 🔢 The level of confidence (e.g., 95%, 99%) determines the width of the confidence interval, with higher confidence levels resulting in wider intervals.
- 🔍 The 'z*' or critical z-score is found using a calculator or z-table based on the desired level of confidence and the alpha value.
- 📉 The script provides a step-by-step example of calculating a 98% confidence interval for the proportion of teachers with student loan debt.
- 📝 The process of constructing a confidence interval is summarized into four steps: naming the procedure, checking conditions, building the interval, and interpreting the interval in context.
Q & A
What is the main focus of Unit 6 in the context of this video?
-The main focus of Unit 6 is inference for categorical data with an emphasis on proportions, including understanding confidence intervals and significance tests for population proportions.
Why is it important to have the study guide from the ultimate review packet while watching this video?
-The study guide is important because it allows viewers to practice the concepts discussed in the video, ensuring they are well-prepared for their unit 6 test and the AP exam in May.
What are the two main procedures used in inference for proportions?
-The two main procedures are confidence intervals and significance tests, which are used to make predictions about population parameters or determine the validity of claims about them.
What conditions must be met for a sample to be considered appropriate for inference about proportions?
-The sample must be random to avoid bias, the sample size must be less than 10% of the population for independence to be assumed, and the sample must contain at least 10 successes and 10 failures.
What is the purpose of a confidence interval in the context of inference for proportions?
-A confidence interval uses a sample statistic to estimate the possible range of values for a population parameter, indicating how close the sample statistic is likely to be to the true population proportion.
How does the size of the sample affect the accuracy of a confidence interval?
-A larger sample size generally leads to a more accurate confidence interval because larger samples are less variable and more closely reflect the population proportion.
What is the meaning of a 95% confidence level in the context of a confidence interval?
-A 95% confidence level means that 95% of all possible samples of the same size taken from the same population will result in an interval that contains the true population proportion.
What is the 'standard error' in the context of constructing a confidence interval for a proportion?
-The 'standard error' is an estimate of the standard deviation of the sampling distribution of the sample proportion, used in place of the true population proportion when it is unknown.
How can a confidence interval be used to justify or refute a claim about a population proportion?
-A confidence interval can be used to justify a claim if the entire interval supports the claim (e.g., all values are above a certain threshold). If the interval includes values that contradict the claim, it does not provide sufficient evidence to confirm the claim.
What is the formula for calculating the margin of error in a confidence interval for a single proportion?
-The margin of error is calculated as the critical z-value (Z*) multiplied by the standard error of the sample proportion, which is the square root of (p_hat * (1 - p_hat)) / n.
How can researchers determine the required sample size for a desired margin of error and confidence level?
-Researchers can use the margin of error formula and solve for the sample size (n) by substituting the desired margin of error and the critical z-value for the chosen confidence level, then rearranging the formula to isolate n.
What is the process for constructing a confidence interval for the difference between two population proportions?
-The process involves naming the procedure, checking conditions for both samples, calculating the observed difference, and then using a formula that includes the critical z-value and the standard error of the difference to find the margin of error, which is added to and subtracted from the observed difference to create the interval.
How should an interval for the difference between two proportions be interpreted?
-The interval for the difference should be interpreted in context, considering whether the entire interval is positive (indicating one group is higher), or if it includes negative values (suggesting the possibility of no difference or the other group being higher).
Outlines
📚 Introduction to Unit 6: Inference for Categorical Data
Michael PR introduces the Unit 6 summer review video, which is part one of two, focusing on inference for categorical data with an emphasis on proportions. He clarifies that this video will not cover every minor detail but aims to summarize key concepts. He advises viewers to have the study guide from the ultimate review packet ready for reference during or after watching. The video will delve into statistical inference, which uses sample statistics to make judgments about population parameters, a concept crucial for understanding units 6 through 8. The unit specifically covers inference procedures for proportions, including confidence intervals and significance tests, and the importance of random and independent sampling is highlighted.
🔍 Understanding Sample Proportions and Confidence Intervals
The paragraph explains the process of creating a confidence interval for a sample proportion, emphasizing the importance of random and independent sampling with sufficient size to ensure the sample contains at least 10 successes and 10 failures. It introduces the concept of a sampling distribution of a sample proportion, which is normally distributed if certain conditions are met. The standard deviation of this distribution, referred to as 'standard error' in this context, is calculated using the sample proportion. The paragraph also discusses how to determine the margin of error using the z-score corresponding to the desired confidence level, and how to construct the confidence interval by adding and subtracting this margin of error from the sample proportion.
📉 Adjusting Confidence Levels and Calculating Sample Size
This section discusses how the confidence level affects the width of the confidence interval, with higher confidence levels requiring wider intervals. It explains the concept of the critical z-score (Zar) and how it is used to determine the number of standard deviations from the sample proportion to capture the true population proportion. The paragraph also covers how to find the critical z-score using a calculator or z-table based on the desired level of confidence. Additionally, it addresses how to calculate the required sample size to achieve a specific margin of error, which involves solving for the sample size 'n' in the margin of error formula using algebraic manipulation.
📝 Constructing a Confidence Interval for a Population Proportion
The paragraph provides a step-by-step guide on constructing a one-sample Z interval for a population proportion, using the example of estimating the proportion of teachers in the United States with student loan debt. It outlines the four-step process: naming the procedure in context, checking conditions for random and independent sampling, building the interval using the sample proportion, the critical z-score, and the standard error, and interpreting the interval in context. The example demonstrates calculating the margin of error and the confidence interval, concluding with an interpretation that reflects a 98% confidence level.
🤔 Interpreting Confidence Intervals and Estimating Sample Size
This section explores the meaning of a confidence level, emphasizing that it refers to the proportion of samples that would result in an interval containing the true population parameter. It clarifies that the confidence level is not a probability statement about the parameter being in the interval. The paragraph also discusses how to use confidence intervals to assess claims about population proportions and explains the process of estimating the required sample size to achieve a desired margin of error, using an example of estimating the proportion of men taking multivitamins.
📊 Estimating the Difference Between Two Population Proportions
The paragraph introduces the process of estimating the difference between two population proportions using a two-sample Z interval. It outlines the steps for constructing this interval, including naming the procedure, checking conditions for both samples, and building the interval using the observed difference between the sample proportions and the standard error of the difference. The example provided uses data from samples of teachers and nurses to estimate the difference in the proportion of each group with student loan debt, resulting in a confidence interval that reflects the potential difference between the two populations.
📌 Interpreting Intervals for Differences and Justifying Claims
This section delves into the interpretation of confidence intervals for the difference between two proportions, emphasizing the importance of understanding the order of subtraction and its impact on the interpretation. It discusses how to use these intervals to justify claims about the difference between population proportions, including how to handle intervals that include both positive and negative values, which could indicate no difference or uncertainty about which group has a higher proportion.
🔚 Conclusion of Part One: Confidence Intervals for Proportions
The final paragraph wraps up part one of the unit on confidence intervals for population proportions. It provides an overview of the formulas needed for constructing confidence intervals, which can be found on the AP stats formula sheet, and highlights the importance of understanding the process and interpretation of these intervals. The paragraph also previews the next video, which will cover significance tests for population proportions, and encourages viewers to continue their learning in part two.
Mindmap
Keywords
💡Inference
💡Categorical Data
💡Proportions
💡Confidence Interval
💡Significance Test
💡Sample Statistic
💡Population Parameter
💡Margin of Error
💡Random Sample
💡Standard Error
Highlights
Introduction to Unit 6 focusing on inference for categorical data with an emphasis on proportions.
Emphasizing the importance of the study guide from the ultimate review packet for exam preparation.
Explanation of the concept of inference using sample statistics to make judgments about population parameters.
Differentiation between confidence intervals and significance tests for analyzing sample proportions.
Conditions required for sample analysis including randomness, independence, and sufficient sample size.
How to calculate the standard error, referred to as 'standard air', when the true population proportion is unknown.
Building a confidence interval for a single sample proportion using the sample proportion and standard error.
Interpreting confidence intervals to estimate the true population proportion.
Adjusting the confidence level to change the width of the confidence interval.
Using the 'invert Norm' function on a calculator or a z-table to find the critical z-score.
Example calculation of a 98% confidence interval for the proportion of teachers with student loan debt.
Understanding the meaning of a given confidence level and how it relates to the sampling distribution.
Using confidence intervals to justify claims about population proportions.
Calculating the required sample size for a desired margin of error and confidence level.
Introduction to constructing confidence intervals for the difference between two population proportions.
Method for estimating the difference between two proportions with an example of teachers versus nurses with student loan debt.
Interpreting intervals for the difference between proportions and understanding the implications of positive or negative intervals.
The significance of sample size in achieving a small margin of error with high confidence.
Conclusion and transition to the next video part focusing on significance tests for population proportions.
Transcripts
Browse More Related Video
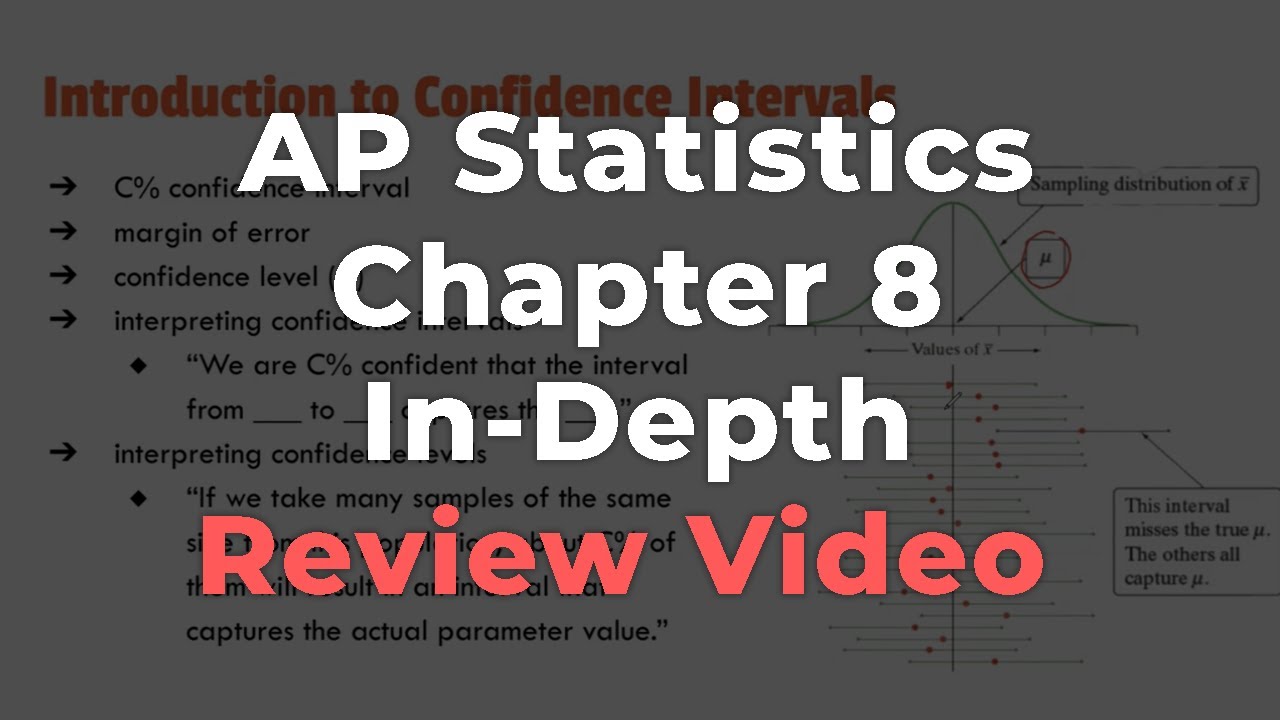
AP Statistics Chapter 8 In-Depth Review Video
5 | MCQ | Practice Sessions | AP Statistics

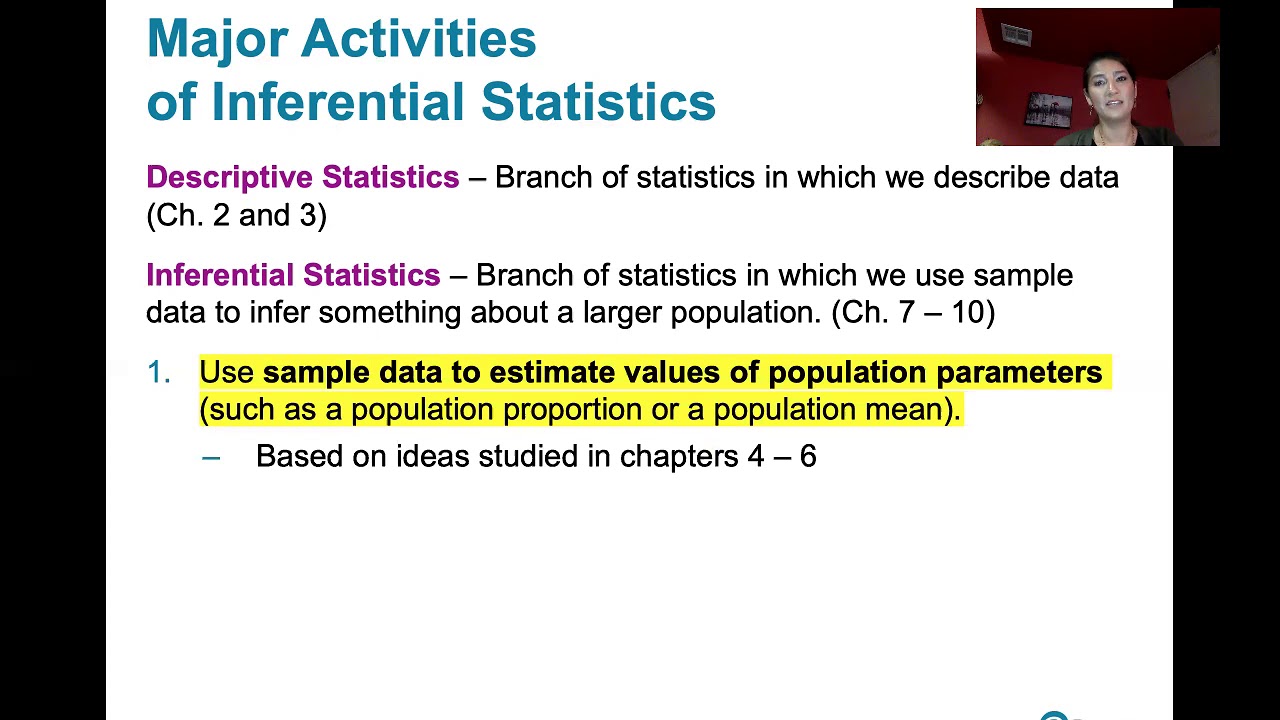
Math 119 Chap 7 part 1

Elementary Statistics - Chapter 7 - Estimating Parameters and Determining Sample Sizes Part 2
7.1.0 Estimating a Population Proportion - Lesson Overview, Key Concepts and Learning Outcomes

Elementary Stats Lesson #16
5.0 / 5 (0 votes)
Thanks for rating: