05 - Using P-Values in Hypothesis Testing (Compare P Value to Level of Significance)
TLDRThis video script provides an in-depth explanation of p-values in the context of hypothesis testing. The presenter clarifies that a p-value represents the probability of observing data more extreme than what was collected, assuming the null hypothesis is true. The video emphasizes that comparing the p-value to a predetermined level of significance (alpha) allows for the decision to either reject or fail to reject the null hypothesis. The script also illustrates the conceptual similarity between p-values and rejection regions, explaining that p-values offer a more flexible and intuitive approach to hypothesis testing. The presenter advocates for understanding the rationale behind p-values, as it aids in grasping why certain outcomes lead to the rejection or acceptance of a null hypothesis. The video concludes by highlighting the practicality of p-values, as they enable researchers to determine the appropriate level of confidence required to reject a null hypothesis, thus facilitating the presentation of statistically significant findings.
Takeaways
- 📊 **P-value Definition**: The p-value is the probability of observing a data point or sample point more extreme than the one collected, assuming the null hypothesis is true.
- 🔍 **Hypothesis Testing**: P-values are used to decide whether to reject or fail to reject the null hypothesis based on the level of significance (alpha).
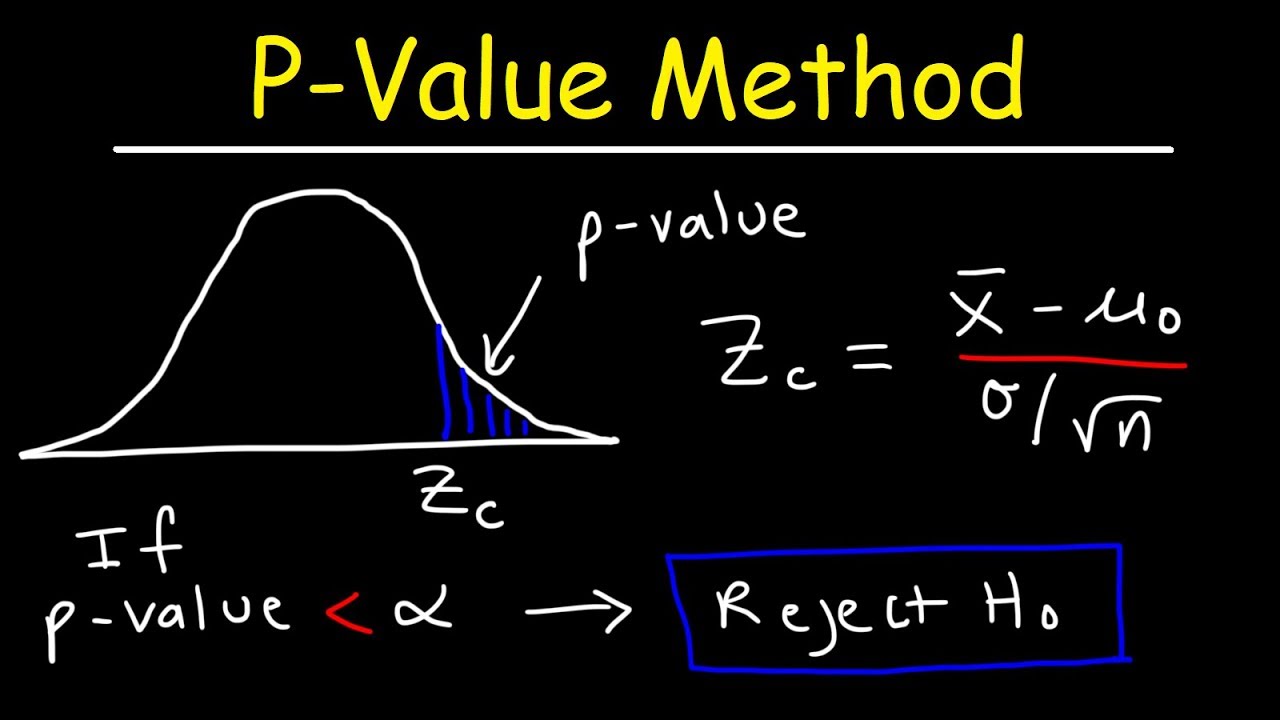
- ✅ **Rejection Criteria**: If the p-value is less than or equal to alpha, the null hypothesis is rejected. If the p-value is greater than alpha, the null hypothesis is not rejected.
- 📉 **Understanding Intuition**: Initially, the relationship between p-values and hypothesis rejection may not be intuitive, but it becomes clearer with examples and illustrations.
- 🔄 **Consistency with Rejection Regions**: P-values are consistent with the concept of rejection regions; they are just a different way to evaluate the same statistical principle.
- 📚 **Educational Process**: Books and teachers often introduce p-values after rejection regions, which can lead to confusion, but understanding that they are fundamentally the same is crucial.
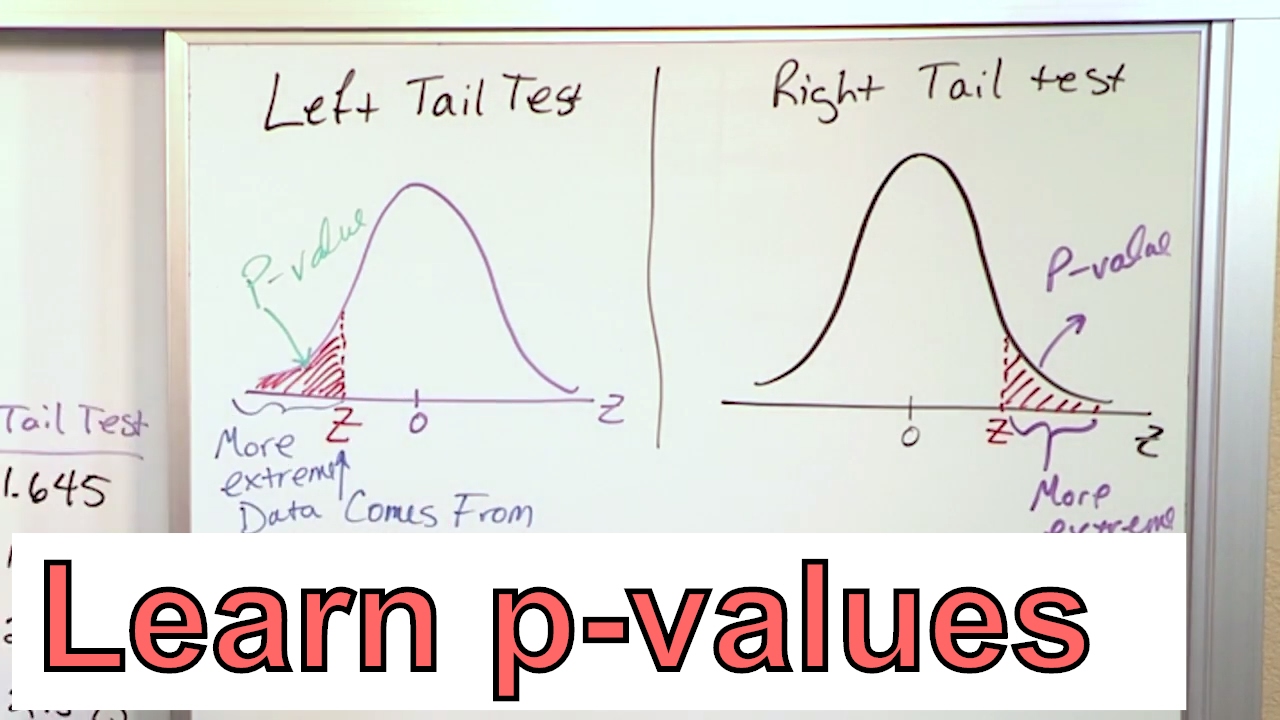
- 📈 **Right-Tail Test Example**: In a right-tail test, the p-value is the area to the right of the test statistic's Z value, and if this area is less than alpha, the null hypothesis is rejected.
- 📉 **Left-Tail Test Example**: Similarly, in a left-tail test, the p-value is the area to the left of the test statistic's Z value, leading to the rejection of the null hypothesis if it's less than alpha.
- 🎯 **Choosing Alpha Level**: P-values allow researchers to select their own level of significance (alpha) that corresponds to the observed data, making it easier to reject the null hypothesis.
- 🛠️ **Practical Application**: P-values are particularly useful in real-life scenarios where researchers aim to disprove a null hypothesis and need to determine the appropriate level of confidence for their claim.
- 📝 **Statistical Reporting**: In statistical reporting, p-values provide a clear and concise way to communicate the strength of evidence against the null hypothesis without having to specify the alpha level beforehand.
Q & A
What is a p-value in the context of hypothesis testing?
-A p-value is the probability of obtaining a data point or sample point more extreme than the data collected for your hypothesis test. It helps determine whether to reject or fail to reject the null hypothesis based on the level of significance (alpha).
How is the decision to reject or fail to reject a null hypothesis made using a p-value?
-If the p-value is less than or equal to the level of significance (alpha), the null hypothesis is rejected. If the p-value is greater than alpha, the null hypothesis is not rejected (failed to reject).
What is the significance of understanding the relationship between p-values and rejection regions?
-Understanding this relationship provides an intuitive grasp of why certain decisions are made regarding the null hypothesis. It clarifies that p-values are essentially a different way of looking at the same concept of rejection regions.
Why might a researcher choose to use a p-value over a fixed level of significance?
-Using a p-value allows a researcher to choose their own level of significance (alpha) that corresponds to the observed data, making it easier to determine when to reject the null hypothesis without having to manually adjust the level of confidence multiple times.
How does a p-value help in determining the level of confidence for rejecting a null hypothesis?
-The p-value tells you the level of significance at which you can reject the null hypothesis. If the p-value is less than or equal to a chosen alpha level, you can reject the null hypothesis at that confidence level.
What is the main advantage of using p-values in hypothesis testing?
-The main advantage is that p-values provide a direct way to determine the appropriate level of significance for rejecting a null hypothesis based on the observed data, without the need for repeated calculations or adjustments to the level of confidence.
Can you explain the concept of a right-tail test using p-values?
-In a right-tail test, the p-value represents the area to the right of the test statistic's Z value. If this area (p-value) is less than or equal to the level of significance (alpha), the null hypothesis is rejected.
How does the process of finding a p-value differ from finding a critical value in hypothesis testing?
-Finding a p-value involves calculating the probability of observing a test statistic as extreme as, or more extreme than, the one calculated from your sample data. In contrast, finding a critical value involves determining the value of the test statistic that corresponds to the chosen level of significance and defines the rejection region.
What is the role of the level of significance (alpha) in hypothesis testing?
-The level of significance (alpha) is the threshold p-value that determines whether there is enough statistical evidence to reject the null hypothesis. If the p-value is less than or equal to alpha, the null hypothesis is rejected.
Why is it important to not just blindly follow the p-value rule without understanding its meaning?
-Understanding the meaning behind the p-value rule provides a deeper understanding of the statistical process and ensures that the results are interpreted correctly. It also helps to avoid misuse of statistical tests and to make more informed decisions based on the data.
How can the process of hypothesis testing using p-values be made more intuitive for learners?
-By relating p-values to the concept of rejection regions, learners can see that the decision-making process is fundamentally the same. Graphical representations and practical examples, such as those involving a normal distribution and Z-values, can also make the process more intuitive.
What is the practical application of understanding p-values in a business or real-world scenario?
-In a business scenario, understanding p-values allows professionals to make data-driven decisions with a clear understanding of the confidence level at which they can reject a null hypothesis. This can be particularly useful when presenting findings to stakeholders or making decisions that could significantly impact the company.
Outlines
📊 Understanding P-Values in Hypothesis Testing
This paragraph introduces the concept of p-values in the context of hypothesis testing. A p-value is defined as the probability of obtaining a data point more extreme than the one from the sample if the null hypothesis were true. The speaker emphasizes the importance of p-values in determining whether to reject or fail to reject the null hypothesis. The criteria for this decision are straightforward: if the p-value is less than or equal to the level of significance (alpha), the null hypothesis is rejected; if the p-value is greater than alpha, the null hypothesis is not rejected. The paragraph also addresses the intuition behind these criteria and how they relate to the concept of rejection regions in hypothesis testing.
📈 Right-Tail Test and P-Value Calculation
The second paragraph delves into a specific type of hypothesis test known as the right-tail test. It explains the process of determining the rejection region based on the level of significance (alpha) and how the critical value of Z is used to find this region. The speaker illustrates that if the test statistic (Z value) falls in the rejection region, the null hypothesis is rejected. The paragraph then connects this process to p-values, showing that the p-value represents the area in the tail to the right of the test statistic. If this area (p-value) is less than or equal to alpha, the null hypothesis is rejected, demonstrating the alignment between p-value analysis and traditional hypothesis testing methods.
📉 Left-Tail Test and its Relation to P-Values
The third paragraph discusses the left-tail test, which is similar to the right-tail test but with the rejection region on the left side of the distribution. The speaker explains that the process of determining whether to reject the null hypothesis using p-values is analogous to the left-tail test. If the test statistic results in a p-value that is less than or equal to alpha, the null hypothesis is rejected. The paragraph reinforces the idea that p-values and rejection regions are two different perspectives on the same concept, with p-values offering a more flexible approach to choosing the level of significance for hypothesis testing.
🔍 The Utility of P-Values in Statistical Analysis
This paragraph questions why p-values are learned and used when rejection regions seem to suffice. The speaker argues that p-values provide the flexibility to choose the level of significance (alpha) for rejecting the null hypothesis. They discuss the practical scenario of a new employee wanting to prove a point about a machine's inefficiency. The paragraph illustrates how adjusting the level of confidence (and thus alpha) can impact the ability to reject the null hypothesis. P-values allow for this adjustment without the need for repeated testing at different confidence levels, making them a preferred method in statistical analysis.
🎯 Applying P-Values in Real-World Scenarios
The fifth paragraph uses a hypothetical scenario to demonstrate how p-values can be applied in a real-world situation. The speaker describes a situation where an employee wants to prove that a candy bar machine is producing bars that are too long. By calculating the p-value from the test statistic and comparing it to the desired level of significance, the employee can determine the exact confidence level at which the null hypothesis can be rejected. This approach streamlines the process of hypothesis testing and allows for a clear presentation of results, such as stating an 88% confidence level in rejecting the null hypothesis.
📝 Conclusion on the Use of P-Values in Hypothesis Testing
The final paragraph summarizes the key points discussed in the script. It reiterates that p-values are used to determine the level of significance required to reject a null hypothesis. The speaker emphasizes that if the p-value is less than or equal to the level of significance, the null hypothesis can be rejected; otherwise, it cannot. The paragraph also highlights the practicality of p-values in allowing researchers to establish the confidence level for their hypothesis tests without prior specification. The speaker concludes by encouraging the audience to move on to the next section for more problem-solving practice with p-values in hypothesis testing.
Mindmap
Keywords
💡p-value
💡hypothesis testing
💡null hypothesis
💡level of significance (alpha)
💡rejection region
💡test statistic
💡confidence level
💡right-tail test
💡left-tail test
💡Z-distribution
💡T-distribution
Highlights
A p-value is defined as the probability of getting a data point or sample point more extreme than the data collected for a hypothesis test.
The p-value is used to determine when to reject or fail to reject a hypothesis, with criteria based on the level of significance (alpha).
If the p-value is less than or equal to alpha, the null hypothesis is rejected; if it's greater, the null hypothesis is not rejected.
The concept of p-values is not new but rather a different perspective on the rejection regions used in hypothesis testing.
In a right-tail test, the p-value corresponds to the area in the tail to the right of the test statistic's Z value.
For a left-tail test, the p-value is the area in the tail to the left of the test statistic's Z value.
The p-value approach allows for an intuitive understanding of hypothesis testing without needing to manually adjust the level of significance.
P-values provide a direct method to choose the level of significance (alpha) needed to reject the null hypothesis.
Using p-values, one can easily determine the confidence level at which the null hypothesis can be rejected without multiple calculations.
In practice, p-values are favored because they allow researchers to develop a case for rejecting a null hypothesis based on the data collected.
The process of hypothesis testing using p-values involves collecting data, calculating the test statistic, determining the p-value, and then identifying the appropriate level of significance to make a decision.
P-values are particularly useful in research and statistical analysis where the goal is often to disprove or reject a null hypothesis.
The level of confidence associated with a p-value can be used to convince a boardroom or other decision-makers of the validity of the research findings.
Understanding the relationship between p-values and rejection regions is crucial for a comprehensive grasp of hypothesis testing.
The use of p-values simplifies the process of hypothesis testing, making it more accessible for researchers and statisticians.
The lesson emphasizes the importance of not just memorizing the process but also gaining an intuitive understanding of why the p-value leads to the rejection or acceptance of a null hypothesis.
Graphical methods are used to illustrate the relationship between p-values, rejection regions, and the decision-making process in hypothesis testing.
The next section of the lesson will involve working through practical problems to solidify the understanding of p-values in hypothesis testing.
Transcripts
Browse More Related Video
Calculate the P-Value in Statistics - Formula to Find the P-Value in Hypothesis Testing

What is p-value? How we decide on our confidence level.

P-Value Problems: Crash Course Statistics #22
P-Value Method For Hypothesis Testing

p-value - easily explained with an example

Statistical Significance and p-Values Explained Intuitively
5.0 / 5 (0 votes)
Thanks for rating: