7.4.1 Graphing an Inequality
TLDRThis video tutorial provides a comprehensive guide on graphing linear and quadratic inequalities. It explains the process step by step, starting with replacing the inequality symbol with an equal sign to draw the boundary line, using dashed or solid lines depending on the type of inequality, and testing points to determine the correct shading for the solution set. The video covers special cases like vertical and horizontal lines and emphasizes the importance of understanding the direction of parabolas and the role of the inequality sign in determining the solution set.
Takeaways
- 📌 An ordered pair (x, y) is a solution to an inequality if it satisfies the inequality.
- 📈 To check an ordered pair, substitute the values into the inequality and verify if the statement holds true.
- 🖼️ The graph of an inequality consists of all ordered pairs that are solutions to the inequality.
- 🟫 When graphing, replace the inequality symbol with an equal sign to find the boundary line of the graph.
- 💻 Use a dashed line for 'just less than' or 'just greater than' inequalities, and a solid line for 'less than or equal to' or 'greater than or equal to'.
- 🔍 Test a point not on the line to see if it satisfies the inequality and shade the correct side of the boundary line.
- 🌟 For linear inequalities, the slope and y-intercept from the equation y = mx + b can be used to graph the line.
- 📊 Special cases include vertical lines (x = k) and horizontal lines (y = k), where k is a constant.
- 🛒 When graphing a quadratic inequality like y ≥ x^2 - 3, graph the corresponding equation y = x^2 - 3 to find the boundary line.
- 🔽 For inequalities involving parabolas, test a point like (0,0) to determine which region to shade for the solution set.
- 🎓 This video provides a comprehensive guide to understanding and graphing linear and quadratic inequalities.
Q & A
What is the main topic of the video?
-The main topic of the video is graphing linear and quadratic inequalities.
How does an ordered pair satisfy an inequality?
-An ordered pair (x, y) satisfies an inequality if substituting the x and y values into the inequality results in a true statement.
What is the first step in graphing an inequality?
-The first step in graphing an inequality is to draw the graph of the equation obtained by replacing the inequality symbol with an equal sign, using a dashed line for 'less than' or 'greater than' and a solid line for 'less than or equal to' or 'greater than or equal to'.
How do you determine whether to use a dashed or solid line when graphing an inequality?
-Use a dashed line if the inequality is 'less than' or 'greater than', and a solid line if the inequality includes 'less than or equal to' or 'greater than or equal to'.
What is the purpose of testing a point with an inequality?
-Testing a point with an inequality helps to determine on which side of the boundary line the solution set lies, and whether to shade the region above or below the line.
How do you find the y-intercept of a linear inequality like y = 2x + 3?
-The y-intercept can be found by looking at the constant term in the equation. In y = 2x + 3, the y-intercept is at the point (0, 3), since when x = 0, y = 3.
What is the boundary line in the context of graphing inequalities?
-The boundary line is the line itself that represents the equation with the inequality symbol replaced by an equal sign. It separates the solution region from the non-solution region.
How do you graph a special linear inequality like x ≥ 2?
-For x ≥ 2, you graph a vertical line at x = 2. If the inequality includes equality, the line is solid; otherwise, it is dashed. The solution set includes the line if equality is allowed.
How do you graph a quadratic inequality like y ≥ x^2 - 3?
-For y ≥ x^2 - 3, you first graph the parabola y = x^2 - 3. If the inequality includes equality, the vertex of the parabola is included in the solution set. Then, you shade the region above the parabola, including the parabola itself if the inequality allows for equality.
What ordered pair is commonly used to test whether a point satisfies an inequality?
-The ordered pair (0, 0) is often used to test whether a point satisfies an inequality because it simplifies the substitution process.
What is the solution set for the inequality y < -3?
-The solution set for the inequality y < -3 is the region below the horizontal line y = -3, excluding the line itself since the inequality does not include an equality.
Outlines
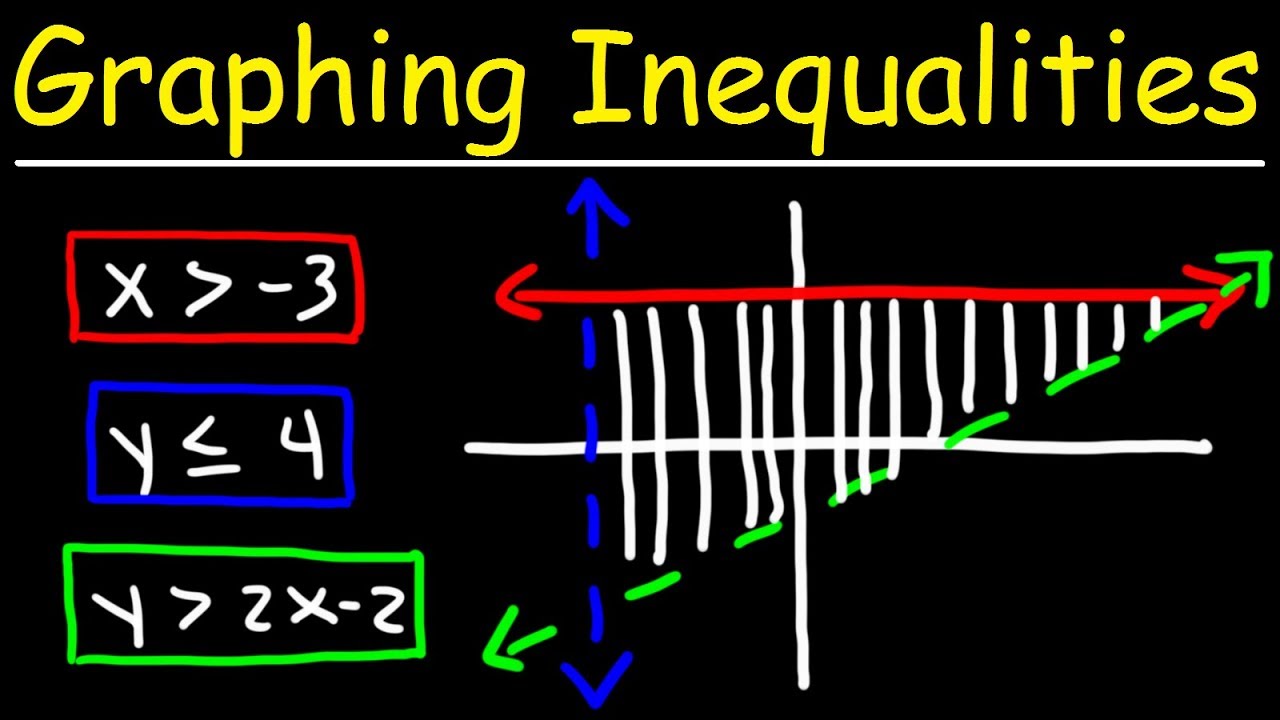
📈 Graphing Linear Inequalities
This paragraph introduces the concept of graphing linear inequalities, explaining that an ordered pair (X, Y) is a solution if it satisfies the inequality. The example given involves the inequality Y < 2x + 3, and the ordered pair (2, 5) is tested. The process of graphing an inequality involves replacing the inequality symbol with an equal sign to draw the boundary line, using a dashed line for strict inequalities and a solid line for inclusive inequalities. The method of testing a point not on the line to determine the correct shading side of the region is also discussed, with the point (0,0) being a common test point. The paragraph concludes with a step-by-step guide to graphing a linear inequality Y ≥ 2x + 3, including drawing the boundary line, testing the point, and shading the correct region.
📊 Special Linear and Quadratic Inequalities
This paragraph continues the discussion on graphing inequalities, focusing on special cases such as X ≥ 2 and Y < -3. For X ≥ 2, the paragraph explains that this represents a vertical line at the x-value of 2, with the solution set being all x-values greater than or equal to 2. The shading would be on the right-hand side of the line. For Y < -3, a horizontal line is drawn at Y = -3, with a dotted line indicating the strict inequality and the solution set being all Y-values below this line. The paragraph then transitions to graphing a quadratic inequality, Y ≥ x^2 - 3, which involves drawing a parabola shifted down by three units. The process of testing the point (0,0) to confirm the shading inside the parabola for the solution set is also described, concluding the explanation of graphing different types of inequalities.
Mindmap
Keywords
💡Inequality
💡Ordered Pair
💡Graph
💡Boundary Line
💡Test Point
💡Shading
💡Linear Inequality
💡Y-Intercept
💡Slope
💡Parabola
💡Solution Set
Highlights
The video discusses graphing inequalities, which are mathematical concepts used to visualize solutions on a coordinate plane.
An ordered pair (x, y) is a solution to an inequality if it satisfies the inequality.
The example given is the inequality y < 2x + 3, and it is shown that the ordered pair (2, 5) satisfies this inequality.
The graph of an inequality consists of all ordered pairs that are solutions to the inequality.
The first step in graphing an inequality is to draw the graph of the corresponding equation with an equal sign代替不等式符号.
A dashed line is used if the inequality is strictly less than or greater than, and a solid line is used for less than or equal to or greater than or equal to.
After plotting the line, a point not on the line is tested to see if it satisfies the inequality to determine the correct shading side.
The video demonstrates graphing a linear inequality y ≥ 2x + 3, including the steps of replacing the inequality symbol with an equal sign and using a solid line for the graph.
The point (0, 0) is tested against the inequality and found not to satisfy it, leading to shading above the boundary line.
Special kinds of linear inequalities, such as x ≥ 2 and y < -3, are also discussed, with the former resulting in a solid vertical line and the latter in a dashed horizontal line.
For the inequality x ≥ 2, the solution set is the region to the right of the vertical line, including the line.
For the inequality y < -3, the solution set is the region below the horizontal line, excluding the line.
The video concludes with an example of graphing a quadratic inequality y ≥ x^2 - 3, which results in a parabola shaded inside to represent the solution set.
The point (0, 0) is again used to test the inequality, and it is found to satisfy it, confirming the shading inside the parabola.
The video provides a comprehensive guide on how to graph different types of inequalities, including linear and quadratic, with clear examples and step-by-step instructions.
Transcripts

5.0 / 5 (0 votes)
Thanks for rating: