Graphing Systems of Linear Inequalities
TLDRThis video script demonstrates the process of graphing and solving systems of linear equations. It begins by graphing individual equations, such as vertical and horizontal lines, and then moves on to more complex systems involving inequalities. The script guides viewers through the steps of plotting lines, determining the regions where the inequalities hold true, and shading the appropriate areas on the graph. It also covers different scenarios, including equations in standard form, and emphasizes the importance of solving for 'y' to simplify graphing. The script aims to help viewers visualize and understand the solution sets for systems of linear equations and inequalities.
Takeaways
- 📈 To graph a system of linear equations, plot each line according to its equation.
- 🔍 For vertical lines, use 'x = a' notation, representing the line at x-coordinate 'a'.
- 📏 Horizontal lines are represented with 'y > a' or 'y < a', with 'a' being the y-coordinate.
- 🖍 Shade the region where all equations are true by combining the areas defined by each line.
- 👆 When 'x > a', shade to the right of the vertical line at 'x = a'.
- 👇 For 'y < a', shade below the horizontal line at 'y = a'.
- 🔄 To find the intersection of regions, consider both the direction (greater than or less than) and the type of line (solid or dashed).
- 📊 For equations in standard form, solve for 'y' to graph the lines in slope-intercept form, making it easier to visualize.
- ✂️ Use dashed lines for inequalities that do not include equality (e.g., 'y > 2x - 3').
- 🔑 The final shaded area represents the solution set where all given linear inequalities are satisfied.
- 📐 To graph a line with a given slope and y-intercept, start from the y-intercept and use the slope to find subsequent points.
Q & A
What is the first step when graphing a system of linear equations?
-The first step is to plot each line individually. This involves determining the slope and y-intercept for each equation and graphing them accordingly.
How do you represent a vertical line in a graph?
-A vertical line is represented by a line that is perpendicular to the x-axis, and it is graphed at the value of x specified in the equation.
What is the significance of a dashed line in the context of graphing inequalities?
-A dashed line indicates that the line is not included in the solution set of the inequality. It is used for inequalities that are 'greater than' or 'less than' but not 'equal to'.
How do you determine the region to shade when graphing a system of linear inequalities?
-The region to shade is where all the inequalities are true simultaneously. This is the area that satisfies all the conditions set by the equations.
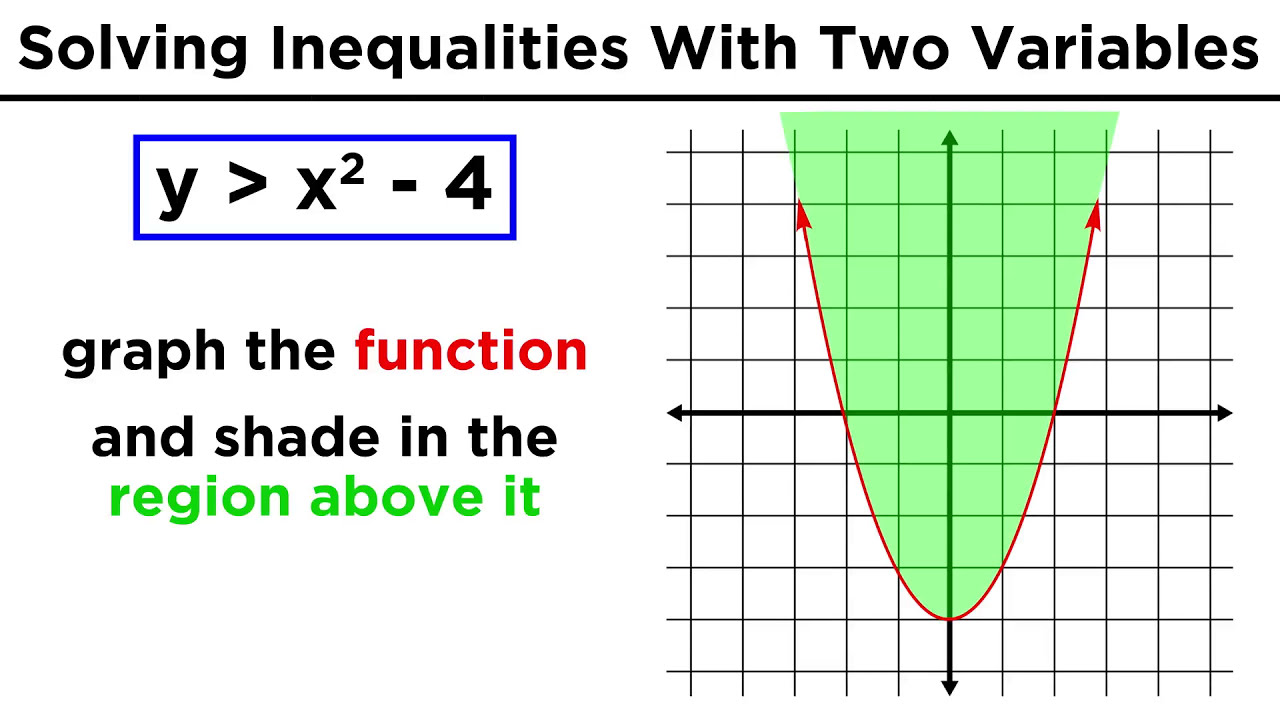
What does it mean when an inequality is given as 'y is greater than a function'?
-When an inequality states 'y is greater than a function', it means that for every x-value, the corresponding y-value must be greater than what the function yields for that x-value.
How do you solve for y in an equation to graph it?
-To solve for y, you isolate y on one side of the equation. This involves moving terms to the other side of the equation and then dividing by the coefficient of y.
What is the purpose of graphing linear equations in standard form?
-Graphing linear equations in standard form allows you to visualize the solution set for the system of equations. It helps in identifying the intersection points and the feasible region where all equations are satisfied.
What is the method used to determine the intersection point of two lines?
-The intersection point of two lines is found by solving the system of equations simultaneously. Alternatively, you can use two points to graph each line and then find where they intersect.
How do you interpret a system of linear equations with both 'greater than' and 'less than' inequalities?
-In a system with both 'greater than' and 'less than' inequalities, you graph each inequality separately and then find the common region where all conditions are met. This region is where the solution to the system lies.
What is the slope-intercept form of a linear equation, and why is it useful for graphing?
-The slope-intercept form of a linear equation is written as y = mx + b, where m is the slope and b is the y-intercept. This form is useful for graphing because it directly gives you the slope and y-intercept, which are needed to plot the line on a graph.
How can you determine the region to shade when dealing with multiple inequalities?
-When dealing with multiple inequalities, you graph each inequality and then identify the region where all the inequalities overlap. This overlapping region is where all conditions are satisfied and is the area to be shaded.
Outlines
🧮 Shading Regions for Linear Equations
This section discusses how to shade the appropriate region for a system of linear equations. It explains graphing lines x = -1 (a vertical dashed line) and y = 2 (a horizontal dashed line), determining shading regions by analyzing x > -1 and y < 2, and combining these regions to find the solution area.
📈 Shading Regions for System of Linear Equations - Example 1
An example is provided with the equations y > 2x - 3 and y < -x + 5. The section demonstrates graphing these lines, identifying y-intercepts and slopes, and shading regions above or below the lines to find the intersection where both inequalities hold true.
📊 Shading Regions for System of Linear Equations - Example 2
This example involves x > 1, y ≤ 6, and y > (3/2)x - 3. It details graphing these lines, analyzing their slopes and intercepts, and shading the appropriate regions to find the area where all three inequalities are satisfied.
🔢 Solving and Graphing Standard Form Equations
Discusses transforming and graphing two linear equations in standard form: 2x + 3y > 6 and 3x - 4y ≤ 12. It includes solving for y, identifying slopes and intercepts, and graphing the resulting lines. It then explains shading the regions to find the solution area satisfying both inequalities.
🔍 Determining the Solution Region
Focuses on finding the correct shaded region for the graphed equations y > -(2/3)x + 2 and y ≥ (3/4)x - 3. It explains shading above or below the lines based on inequalities and identifying the region where both conditions are met.
Mindmap
Keywords
💡System of Linear Equations
💡Graphing
💡Vertical Line
💡Horizontal Line
💡Dashed Line
💡Slope
💡Y-Intercept
💡Inequality
💡Solution Region
💡Test Points
💡Solving for a Variable
Highlights
Introduction to graphing systems of linear equations to find the solution region.
Plotting the line x = a > -1 as a vertical saddle line.
Graphing another line at x = 2 as a horizontal line with y > 2 as a dashed line.
Shading the region to the right of the vertical line for x > a.
Shading below the horizontal line for y < 2 to find the solution region.
Combining shaded regions where both equations are true.
Exploring the second example with y > 2x - 3 and y < -x + 5.
Graphing the line with a y-intercept of -3 and slope of 2.
Using a dashed line to represent y > 2x - 3.
Graphing the second equation with a y-intercept of 5 and slope of -1.
Determining the correct region to shade by analyzing both equations.
Shading the region where both y > 2x - 3 and y < -x + 5 are true.
Solving for y in standard form equations to graph them.
Graphing the equation y > -2/3x + 2.
Graphing the second equation y ≥ 3/4x - 3.
Identifying the correct shaded region for the system of equations.
Shading above the red line for y > -2/3x + 2 and above the gray line for y ≥ 3/4x - 3.
Final shaded region represents the solution for both equations.
Transcripts
Browse More Related Video
Solving and Graphing Polynomial and Rational Inequalities
ILLUSTRATING THE SYSTEM OF NONLINEAR EQUATIONS || PRECALCULUS
SOLVING SYSYEM OF NONLINEAR EQUATIONS || PRECALCULUS
Calculus AB Homework 4.1: Implicit Differentiation
7.4.1 Graphing an Inequality

Ch. 10.1 Systems of Linear Equations in Two Variables
5.0 / 5 (0 votes)
Thanks for rating: