Bivariate relationship linearity, strength and direction | AP Statistics | Khan Academy
TLDRThe video script discusses the analysis of six scatter plots illustrating relationships between different variables. It delves into identifying whether these relationships are linear or non-linear and their strength, be it positive or negative. The concept of outliers is also introduced, noting subjectivity in their identification. The aim is to help viewers understand the terminology and methods of analyzing bivariate data.
Takeaways
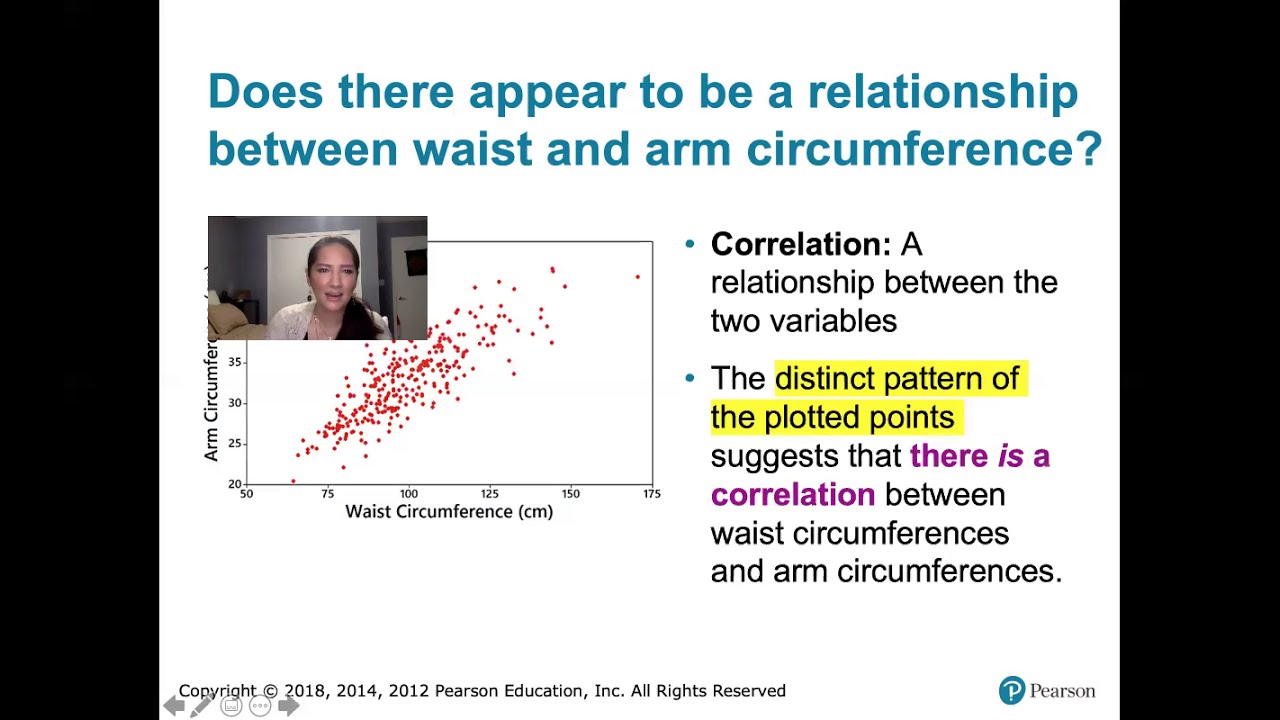
- 📊 Scatter plots are used to visualize the relationship between two variables.
- 🔍 Bivariate data refers to data that considers two variables at a time, aiming to identify patterns in their relationship.
- 📉 A linear relationship can be identified when one variable increases, the other also increases or decreases in a straight line pattern.
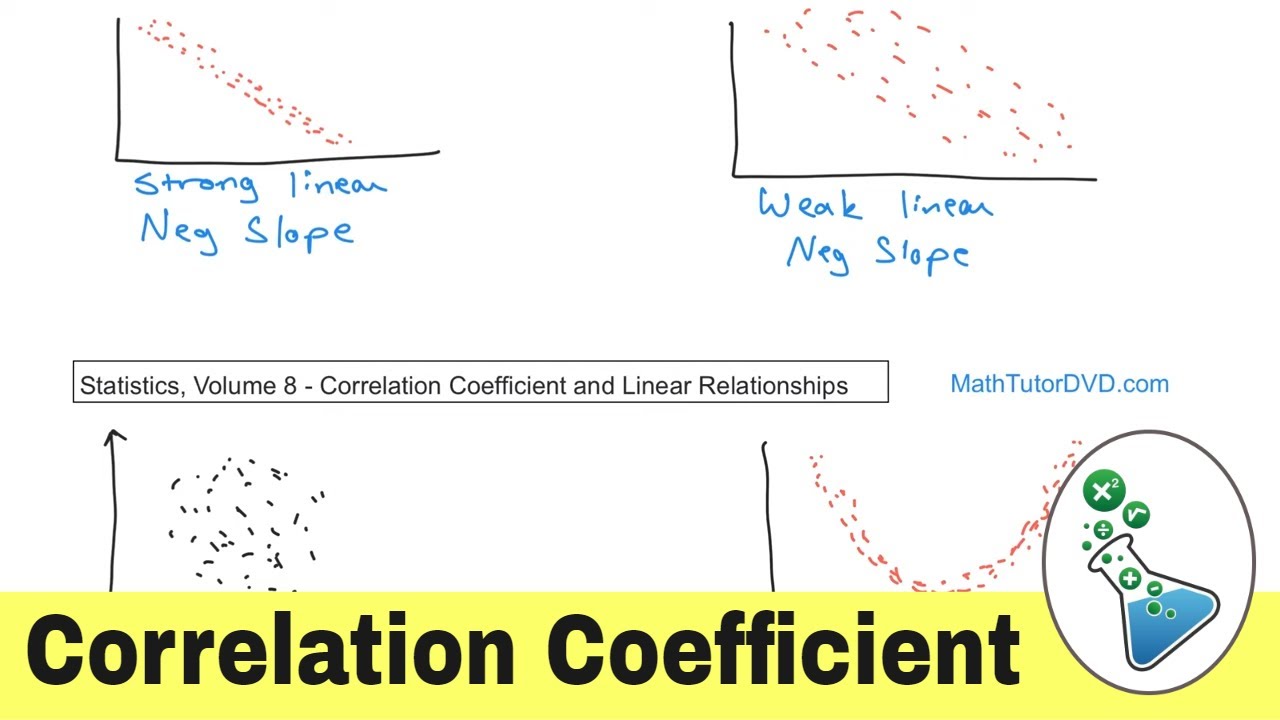
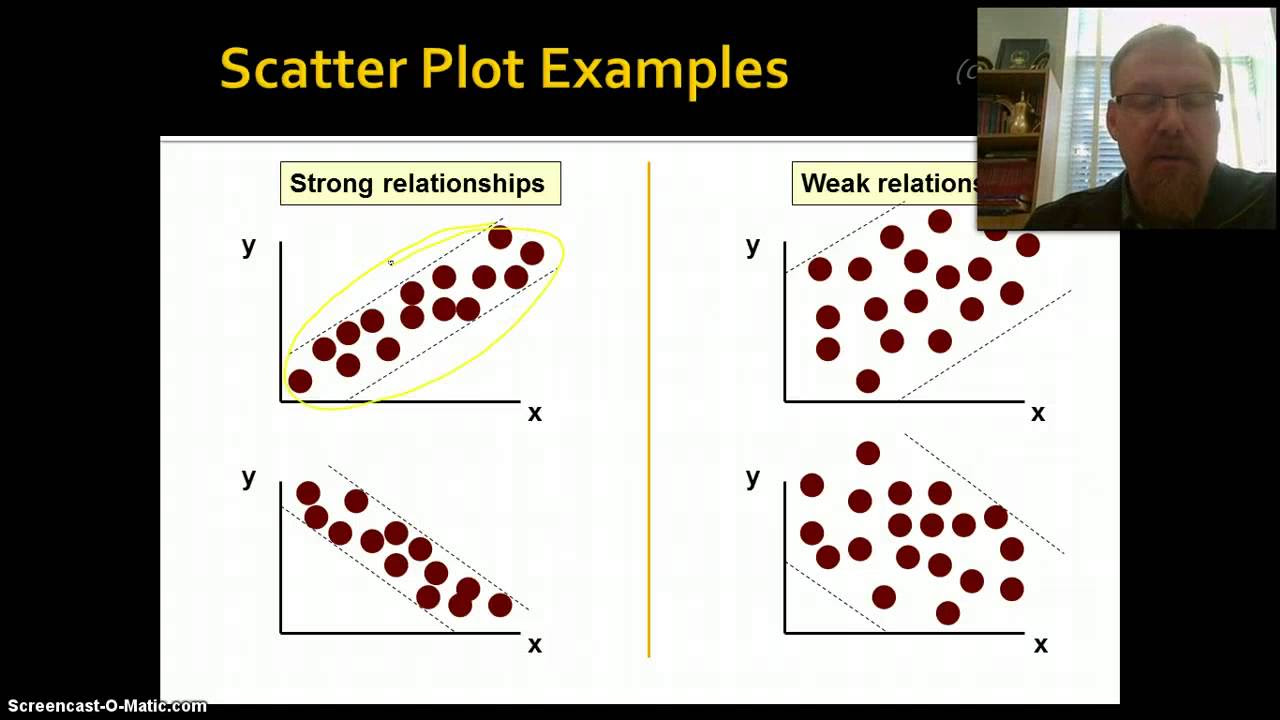
- 📈 A strong linear relationship is indicated when data points are close to the line of best fit.
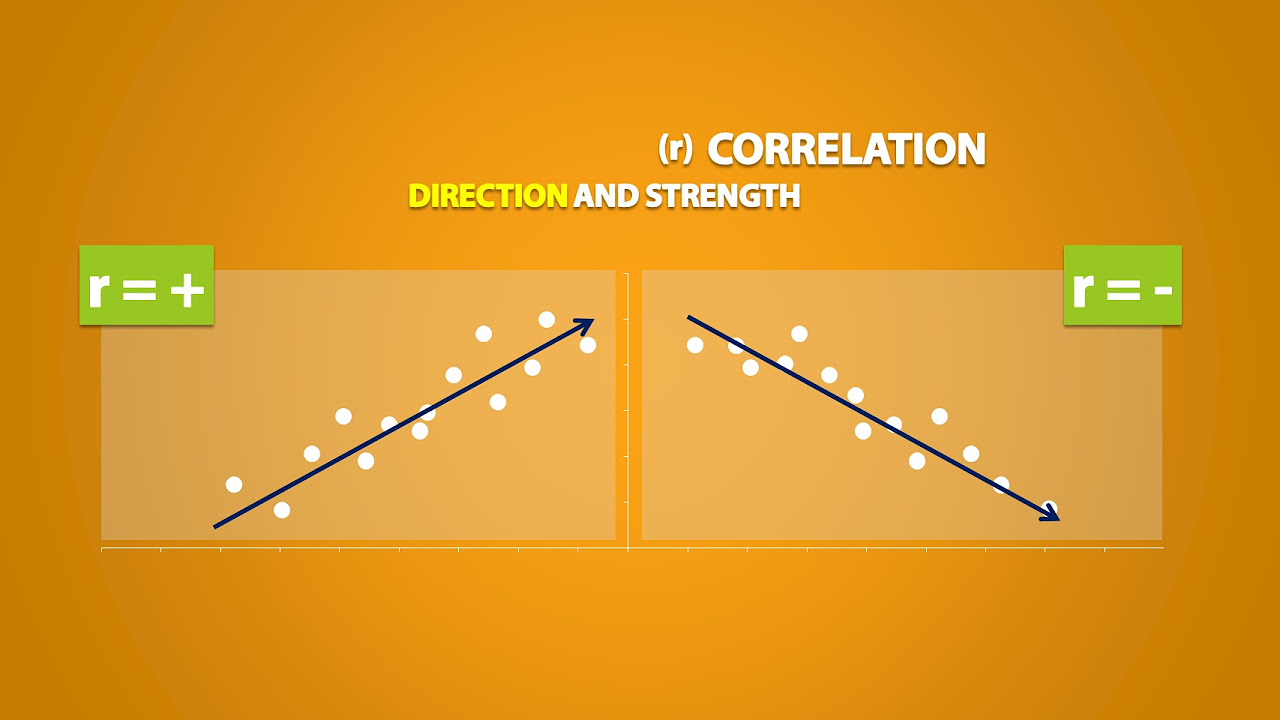
- 📉 A negative linear relationship is present when an increase in one variable corresponds to a decrease in the other variable.
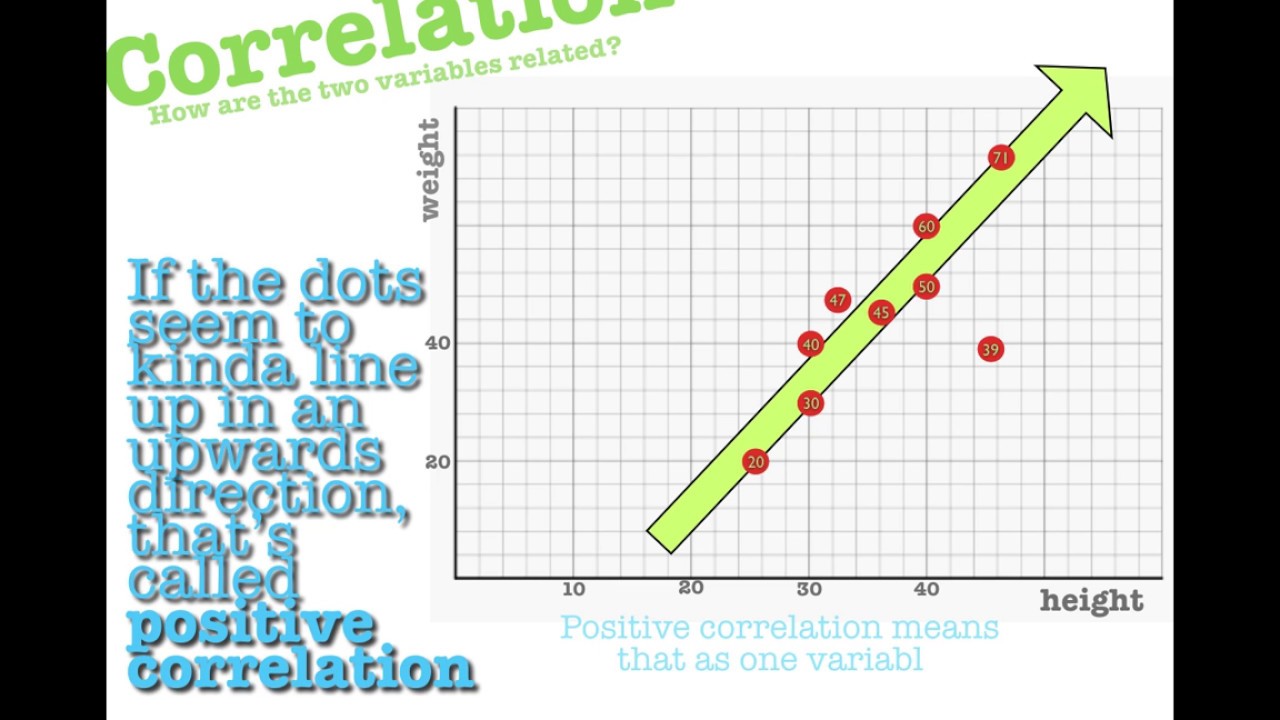
- 🔼 A positive linear relationship occurs when both variables increase or decrease together in a linear fashion.
- 🚫 Outliers are data points that are significantly far from the trend of the other points and can affect the perception of the relationship.
- 🔍 Identifying relationships and outliers is somewhat subjective, and different analysts may have slightly different interpretations.
- 🛠️ Tools like a ruler or computer algorithms can be used to fit a line or curve to the data, but a visual inspection (eyeballing) can also provide insights.
- 📊 Non-linear relationships are suggested when data points do not follow a straight line and instead curve or bend in their relationship.
- 🔍 Comparing relationships can help determine which has a stronger or weaker linear or non-linear connection.
Q & A
What is the main focus of the video?
-The main focus of the video is to analyze the relationships between different variables in six scatter plots and determine whether these relationships are linear or non-linear, strong or weak, and to identify any outliers present in the data.
What is bivariate data?
-Bivariate data refers to data that involves the examination of two variables, where the relationship between these variables is of interest. In the context of the video, scatter plots are used to visualize these relationships.
How can one determine if a relationship between variables is linear or non-linear?
-A linear relationship can be identified if there is a straight line that roughly fits the data points, indicating a consistent change in one variable as the other variable changes. Non-linear relationships, on the other hand, are characterized by a curve or a pattern that cannot be described by a straight line, suggesting a variable change that does not follow a constant rate.
What does it mean for a relationship to be strong or weak?
-A strong relationship implies that there is a clear and consistent pattern observed in the data, where changes in one variable are closely related to changes in the other variable. A weak relationship, however, indicates that the data points do not follow the pattern as closely, and there may be considerable variation from the observed trend.
What is an outlier in the context of scatter plots?
-An outlier is a data point that is significantly different from the other data points in the scatter plot. It lies far away from the line or curve that represents the general trend of the data, suggesting that it may not follow the same pattern as the majority of the data.
How does one identify outliers in scatter plots?
-Outliers can be identified by observing data points that are far away from the line or curve that represents the trend of the data. These points do not conform to the general pattern observed in the majority of the data and may indicate errors, unique conditions, or simply variability in the data set.
What is the significance of identifying the type of relationship (linear/non-linear, strong/weak) between variables?
-Identifying the type of relationship between variables helps in understanding how the variables interact with each other. It can inform decisions about data analysis methods, model selection, and predictions. For instance, knowing if a relationship is linear allows for the use of simpler models like linear regression, while non-linear relationships may require more complex models.
How can the presence of outliers impact the analysis of data?
-Outliers can significantly impact the analysis of data by skewing the results and misleading the interpretation of relationships between variables. They can affect the fit of a line or curve, potentially leading to incorrect conclusions about the nature of the relationship. It's important to investigate outliers to determine if they are valid data points or if they are errors that need to be corrected or removed.
What methods can be used to fit a line or curve to a scatter plot?
-Methods such as linear regression can be used to fit a straight line to the data, while more complex models like polynomial regression or non-parametric methods can be used to fit curves to non-linear relationships. These methods aim to find the best fit that minimizes the distance between the data points and the line or curve.
How does the instructor approach the analysis of the scatter plots?
-The instructor uses a combination of visual inspection (eyeballing) and hypothetical examples to analyze the scatter plots. They discuss the relationships in terms of being linear or non-linear, strong or weak, and identify outliers based on their distance from the trend line.
What is the subjective nature of identifying relationships and outliers in data?
-The subjective nature of identifying relationships and outliers arises because the interpretation can vary depending on the individual analyzing the data. What one person may consider a strong relationship or a clear outlier might not be as evident to another. This is why it's important to use both visual inspection and statistical methods to support the analysis.
Outlines
📊 Understanding Scatter Plots and Relationships
This paragraph introduces the concept of scatter plots and their use in representing the relationship between two variables. The instructor explains how data points on the plots can reveal patterns, such as whether the relationship is linear or non-linear, and the strength of the relationship (positive or negative). The discussion also touches on the concept of outliers, which are data points that significantly deviate from the observed pattern. The instructor uses a ruler tool to visually estimate the relationships and identify outliers within the scatter plots.
📈 Analyzing Linear and Non-Linear Relationships
In this paragraph, the focus is on distinguishing between linear and non-linear relationships within scatter plots. The instructor provides examples of both types of relationships, highlighting how to identify them by attempting to fit a line or curve to the data points. The strength of the relationships is further discussed, with the instructor noting the presence of outliers and how they can affect the interpretation of the data. The use of visual tools to approximate lines and curves is emphasized, as well as the subjectivity involved in making these determinations.
Mindmap
Keywords
💡scatter plots
💡bivariate data
💡linear relationship
💡negative linear relationship
💡strong relationship
💡outliers
💡non-linear relationship
💡eyeballing
💡data points
💡positive relationship
💡weak relationship
Highlights
The introduction of six different scatter plots to analyze the relationship between variables.
The use of the horizontal axis to represent age and the vertical axis to represent accident frequency as an example.
The concept of bivariate data, plotting two variables to see if there's a pattern in their relationship.
The method of fitting a line to data points to determine if there's a linear or non-linear relationship.
The identification of a negative linear relationship where one variable decreases as the other increases.
The assessment of the strength of the relationship, such as strong or weak, based on how close data points are to the fitted line.
The introduction of the concept of outliers, data points that are significantly far from the rest of the data.
The demonstration of a positive linear relationship where both variables increase together.
The explanation of a weak positive linear relationship with many data points far from the line.
The illustration of a strong positive linear relationship with data points closely following the fitted line.
The identification of a non-linear relationship where data points do not follow a straight line but rather a curve.
The description of a negative, reasonably strong non-linear relationship with data points bending away from the line.
The discussion on the subjectivity involved in identifying outliers and the strength of relationships.
The comparison between different scatter plots to understand the differences in linearity and strength of relationships.
The practical application of these concepts in data science and statistics for analyzing relationships between variables.
Transcripts
Browse More Related Video
10.1.1 Correlation - Linear, Nonlinear, Positive Linear, and Negative Linear Correlation Defined
Scatter Plots and Bivariate Data
What is the Correlation Coefficient in Statistics?
Correlation Doesn't Equal Causation: Crash Course Statistics #8
Explanatory and Response Variables, Correlation (2.1)
Introduction to Correlation & Regression, Part 1
5.0 / 5 (0 votes)
Thanks for rating: