Introduction to Correlation & Regression, Part 1
TLDRIn this educational screencast, Alex introduces the concepts of linear regression and correlation analysis, aiming to help viewers understand and interpret the relationships between variables. The focus is on visualizing data through scatterplots to identify the strength and direction of linear relationships, without implying causation. Alex also explains the calculation of the correlation coefficient, R, which measures the strength of the linear relationship in a sample, and its significance in statistical analysis. The script sets clear learning objectives, including calculating and interpreting correlations, determining their significance, and understanding regression analysis assumptions.
Takeaways
- 📈 The video discusses linear regression and correlation analysis, aiming to help viewers understand how to visualize relationships and interpret statistical results.
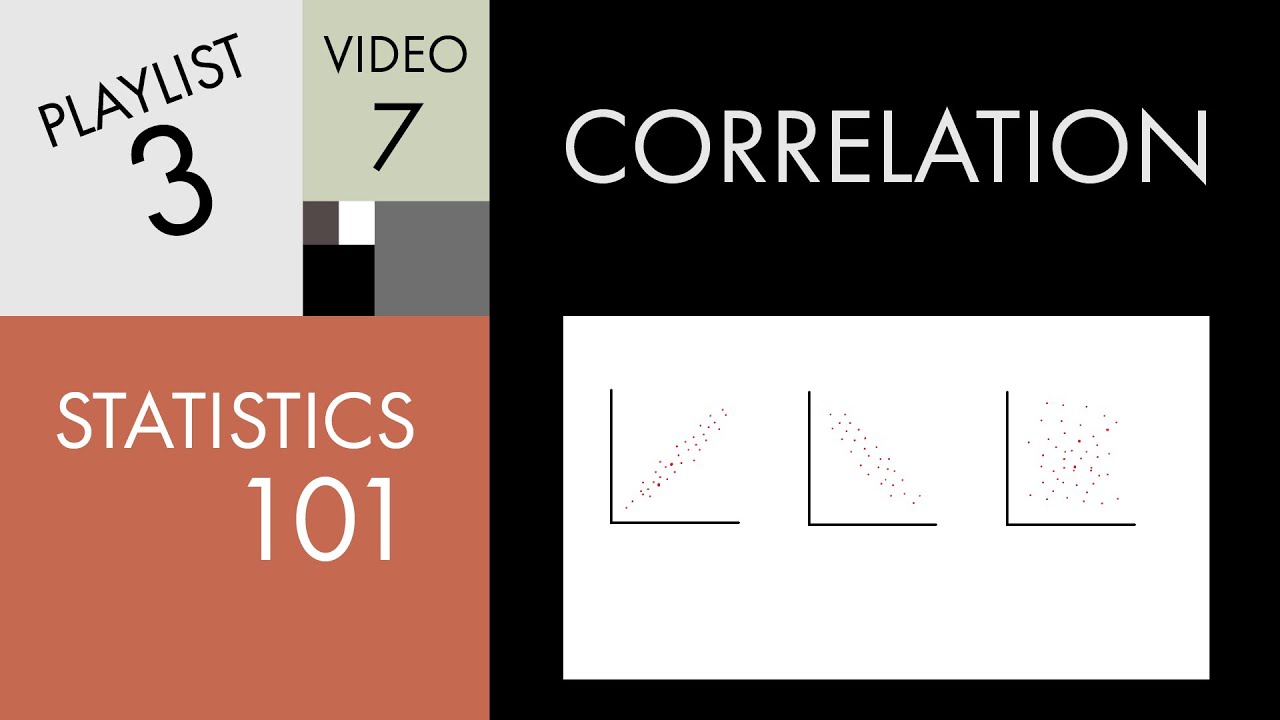
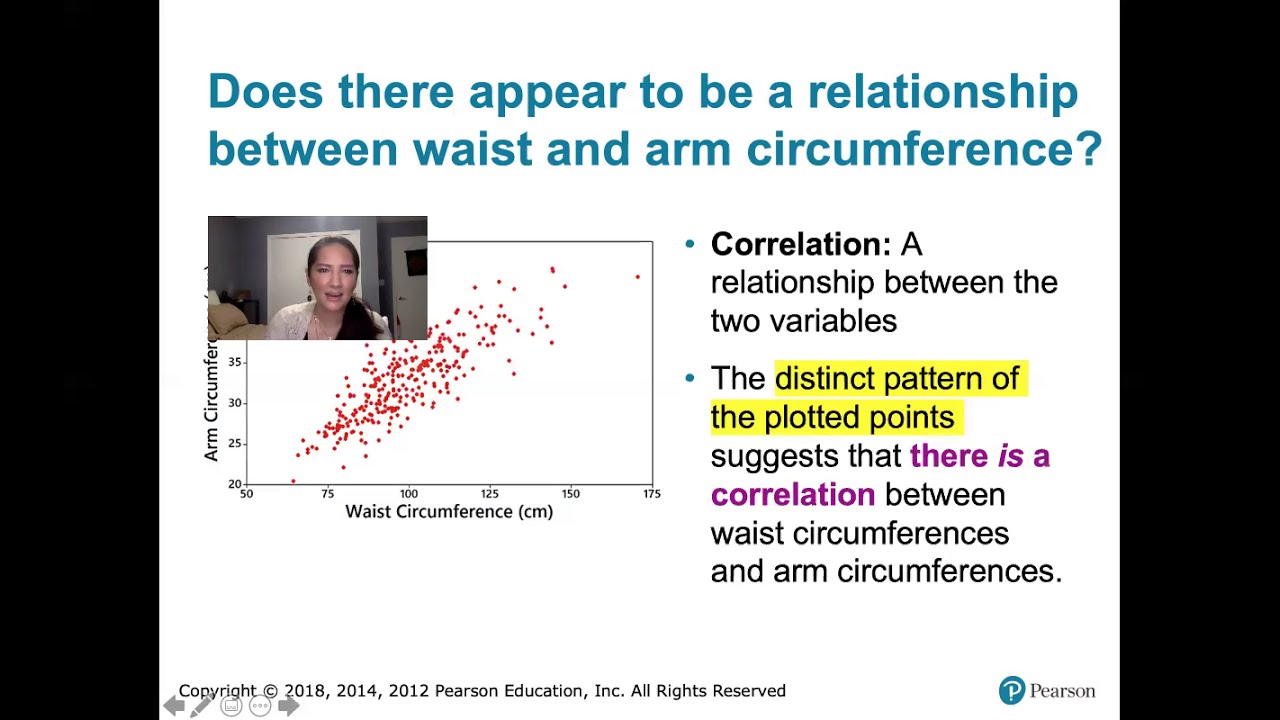
- 📊 The script emphasizes the importance of scatterplots in visualizing the correlation between two variables, highlighting the strength and direction of their relationship.
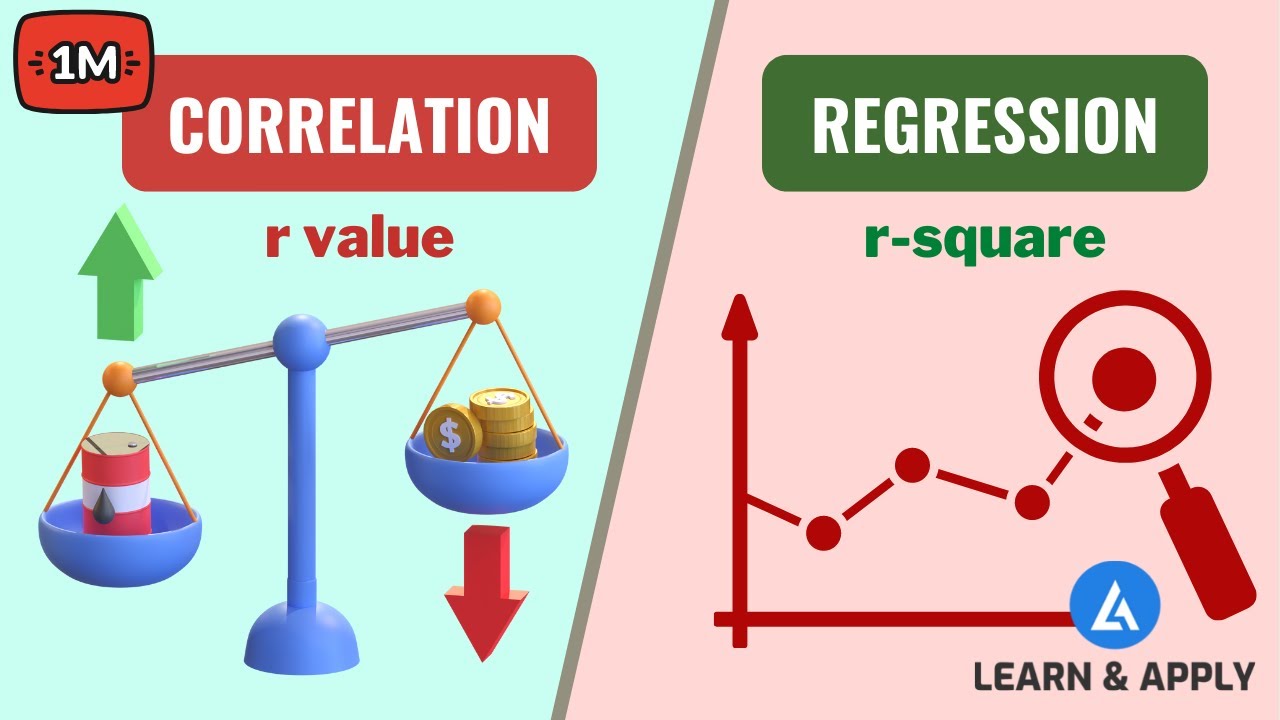
- 🔍 The correlation coefficient, denoted as R, is a key concept, measuring the strength and direction of the linear relationship between variables, ranging from -1 (perfect negative correlation) to 1 (perfect positive correlation).
- 🔢 The script explains that a correlation coefficient close to zero indicates a weak linear relationship, while values closer to -1 or 1 indicate strong relationships.
- 🌳 An example is given using the relationship between tree height and trunk diameter, demonstrating how to calculate the correlation coefficient.
- 📚 The script mentions that correlation analysis does not imply causality, focusing only on the strength and direction of the relationship.
- 📉 The video will cover how to calculate and interpret the simple linear regression equation, understand the assumptions behind regression analysis, and determine the significance of a regression model.
- 📊 The script differentiates between linear relationships, which can be represented by a straight line, and curvilinear relationships, which involve curved lines.
- 📚 The video will also discuss confidence intervals, prediction applications, and potential problems in regression analysis, though these topics might be covered in a different set of screencasts.
- 🔍 The script provides a formula for calculating the correlation coefficient, emphasizing the mathematical process behind the calculation.
Q & A
What is the main topic of the video script?
-The main topic of the video script is linear regression and correlation analysis, focusing on how to visualize relationships and interpret the results from statistical software programs.
What are the goals for the screencasts on correlation and linear regression?
-The goals are for viewers to be able to calculate and interpret the simple correlation between two variables, determine if the correlation is significant, calculate and interpret the simple linear regression equation for a set of data, understand the assumptions behind regression analysis, and determine if a regression model is significant.
What is a scatterplot used for in the context of correlation analysis?
-A scatterplot is used to visualize the relationship or association between two different variables, showing the strength and direction of the linear relationship without implying causality.
What does a linear relationship in a scatterplot look like?
-A linear relationship in a scatterplot appears as points that group together in a positive or negative way, indicating a straight line can be drawn through the points, showing a consistent increase or decrease in one variable with changes in the other.
How is the strength of a linear relationship represented in a scatterplot?
-The strength of a linear relationship is represented by how tightly the points are clustered around a line in the scatterplot. The tighter the cluster, the stronger the relationship.
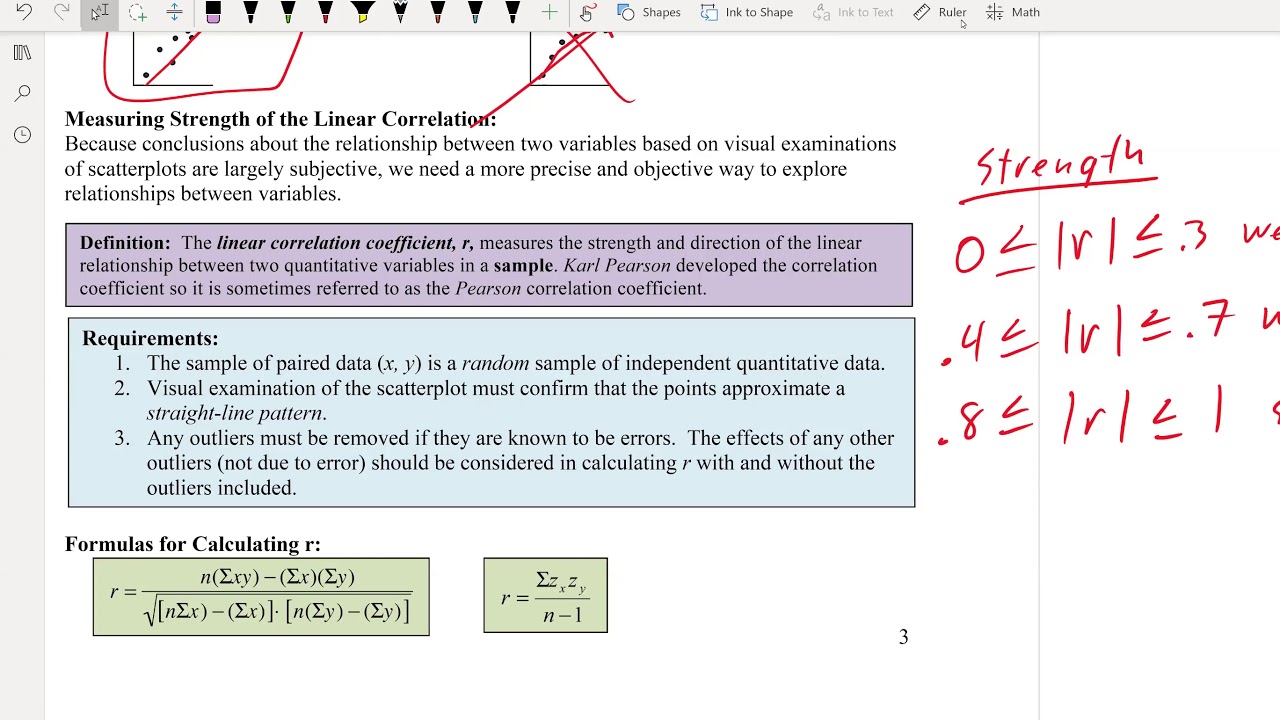
What is the correlation coefficient and what does it measure?
-The correlation coefficient, often denoted as 'R' for a sample, measures the strength and direction of the linear relationship between two variables in a sample. It is unit-free and ranges from -1 to 1, with values closer to -1 or 1 indicating stronger relationships.
What does a correlation coefficient of -1 indicate?
-A correlation coefficient of -1 indicates a perfectly negative linear relationship, where for every one unit increase in one variable, there is a one unit decrease in the other variable.
What does a correlation coefficient of 0 indicate?
-A correlation coefficient of 0 indicates no linear relationship between the two variables, suggesting that changes in one variable do not predict changes in the other.
How is the sample correlation coefficient calculated?
-The sample correlation coefficient is calculated using a formula that involves summing the products of the differences between each individual score and the mean for both variables, divided by the square root of the product of the sums of the squared differences from the mean for each variable.
Can you provide an example of how to calculate the correlation coefficient using the script's tree height and trunk diameter example?
-Yes, the script provides an example where you would calculate the sums of X, Y, XY, X squared, and Y squared, then use these sums in the correlation coefficient formula to find the strength and direction of the relationship between tree height (Y) and trunk diameter (X).
What is significance testing in the context of correlation and linear regression?
-Significance testing is a statistical method used to determine if the observed correlation or regression model is statistically significant, meaning it is unlikely to have occurred by chance. The script mentions that this topic will be covered in a subsequent screencast.
Outlines
📊 Introduction to Linear Regression and Correlation Analysis
Alex introduces the topic of linear regression and correlation analysis, building on previous discussions. The aim is to visualize relationships between variables and understand the calculations and interpretations behind these statistical analyses. The goals include calculating and interpreting simple correlation, determining significance, performing linear regression, and understanding the assumptions of regression analysis. The focus is on using scatterplots to visualize correlations, emphasizing the importance of recognizing the strength and direction of relationships without implying causation.
🔍 Understanding Correlation Coefficients and Their Visual Representation
This section delves into the concept of the correlation coefficient, distinguishing between population and sample coefficients. The sample correlation coefficient, denoted as 'R', measures the strength and direction of the linear relationship within a sample, with values ranging from -1 to 1. A detailed explanation of how these values represent different types of relationships is provided, including perfectly negative, perfectly positive, and no relationships. The visual representation of these relationships through scatterplots is also discussed, illustrating how紧密 grouped points indicate a strong relationship, while a wide distribution suggests a weaker one.
🌳 Practical Example: Calculating Correlation Between Tree Height and Trunk Diameter
Alex presents a practical example to demonstrate the calculation of the correlation coefficient using the relationship between tree height and trunk diameter. The process involves creating a table with sums of products, squared values, and sums of individual variables. By plotting the data points and calculating the correlation coefficient, the example shows a strong positive linear relationship, which is visually represented by a tight linear distribution of points. The summary also mentions that such calculations can be performed using statistical software like Excel or SPSS, and the importance of significance testing will be covered in subsequent screencasts.
Mindmap
Keywords
💡Linear Regression
💡Correlation Analysis
💡Scatterplot
💡Correlation Coefficient
💡Significance Testing
💡Assumptions of Regression Analysis
💡Simple Linear Regression Equation
💡Unit-Free
💡Statistical Significance
💡Nonlinear Relationships
Highlights
Introduction to linear regression and correlation analysis.
Discussion on visualizing relationships in data.
Explanation of how to interpret the results from statistical software.
Goal to calculate and interpret the simple correlation between two variables.
Goal to determine the significance of the correlation.
Goal to calculate and interpret the simple linear regression equation for a set of data.
Understanding the assumptions behind regression analysis.
Determining whether a regression model is significant.
Introduction to interpreting confidence intervals.
Recognizing different applications for prediction and description.
Identifying potential problems in using regression analysis.
Handling nonlinear relationships in regression analysis.
Visualizing data using a scatterplot to show the relationship between two variables.
Explanation of correlation analysis measuring the strength and direction of the relationship.
Clarification that correlation does not imply causation.
Description of linear relationships and how they can be plotted with a line.
Discussion on curvilinear relationships and their characteristics.
Explanation of the strength of relationships and how it is visualized.
Definition and explanation of the correlation coefficient.
Description of the sample correlation coefficient as an estimate of the population correlation coefficient.
Explanation of the unit-free nature and the range of the correlation coefficient.
Visual representation of perfect negative and positive relationships.
Calculation example using the height and trunk diameter of trees.
Method to calculate the correlation coefficient using a formula.
Use of statistical software like Excel or SPSS to calculate correlation coefficients.
Introduction to significance testing for correlation coefficients.
Transcripts
Browse More Related Video
Correlation and Regression Analysis: Learn Everything With Examples
Statistics 101: Understanding Correlation
Math 119 Chapter 10 Part 1

Elementary Stats Lesson #5
Correlation Doesn't Equal Causation: Crash Course Statistics #8
10.1.1 Correlation - Linear, Nonlinear, Positive Linear, and Negative Linear Correlation Defined
5.0 / 5 (0 votes)
Thanks for rating: