AP physics Motion Diagram Notes
TLDRThe video script is an informative guide for AP Physics students on understanding motion diagrams. It explains the relationship between displacement, velocity, and acceleration through visual representation. The key concepts include recognizing constant and changing slopes, which indicate varying velocities and accelerations. The script emphasizes the importance of understanding how these elements interact, especially in determining when velocity is zero. It also briefly touches on calculating areas for different shapes, which is relevant for analyzing motion diagrams.
Takeaways
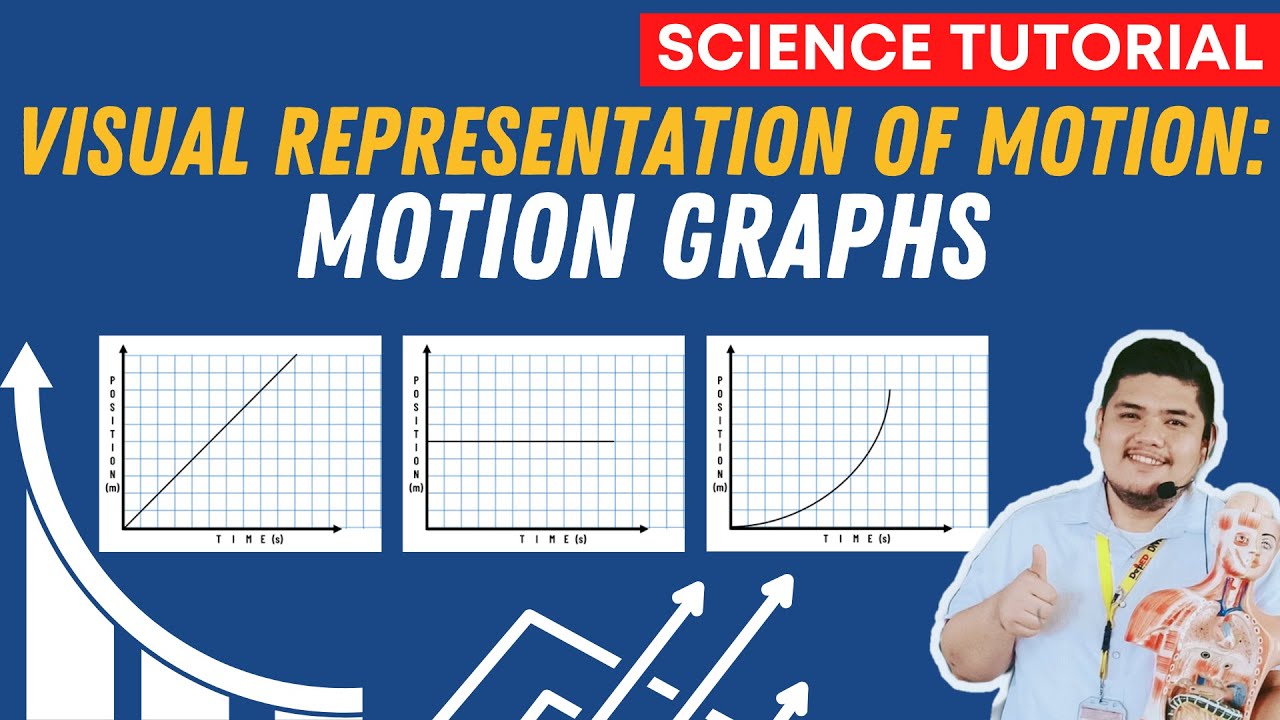
- 📈 A motion diagram is a visual tool to understand the relationship between position, velocity, and acceleration over time.
- 🔄 The script transitions from discussing position to velocity and acceleration, highlighting their interconnections.
- 📌 The X-axis represents displacement, while the Y-axis can represent either velocity or acceleration, depending on the graph.
- 🚀 An increasing slope in the velocity graph indicates increasing velocity, and vice versa for a decreasing slope.
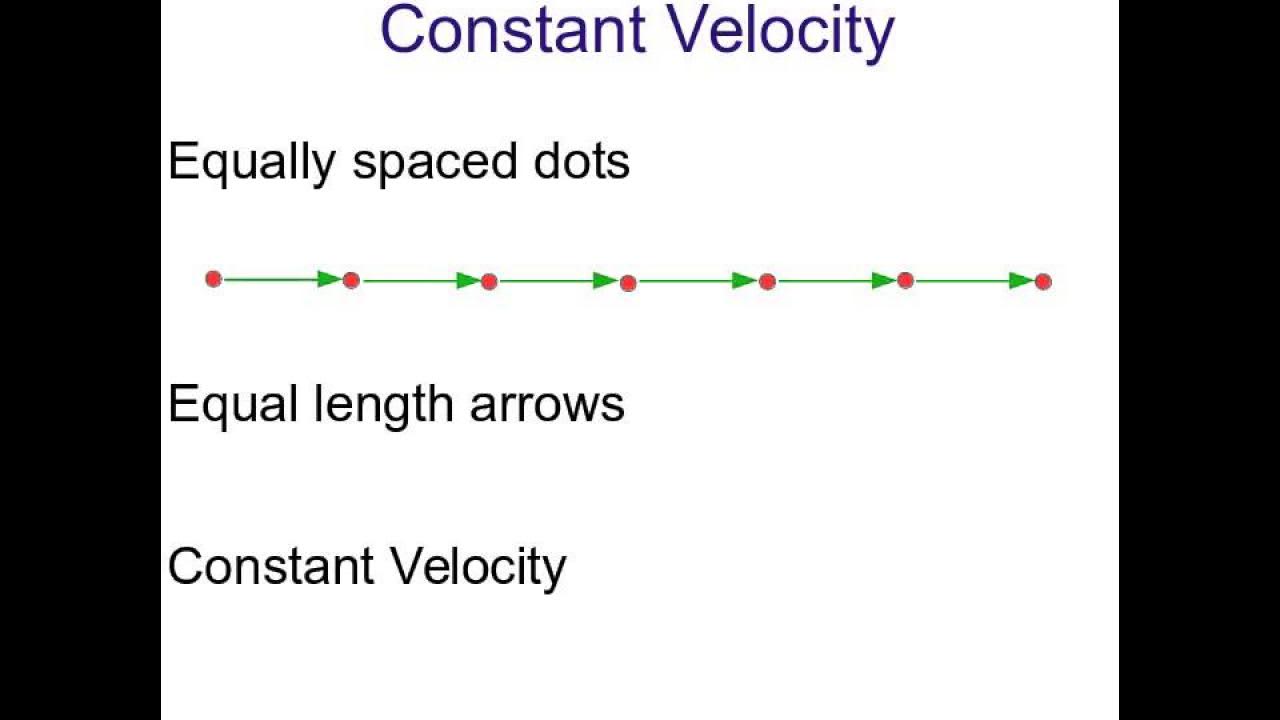
- 📉 A straight line in the velocity graph signifies constant velocity, while a curve indicates changing velocity.
- 🔽 A positive slope in the acceleration graph indicates positive acceleration (speeding up), and a negative slope indicates negative acceleration (slowing down).
- 🔄 The absence of slope (flat line) in the acceleration graph indicates zero acceleration, which corresponds to constant velocity.
- 📍 The highest point in the position graph represents the maximum height or distance when velocity is zero.
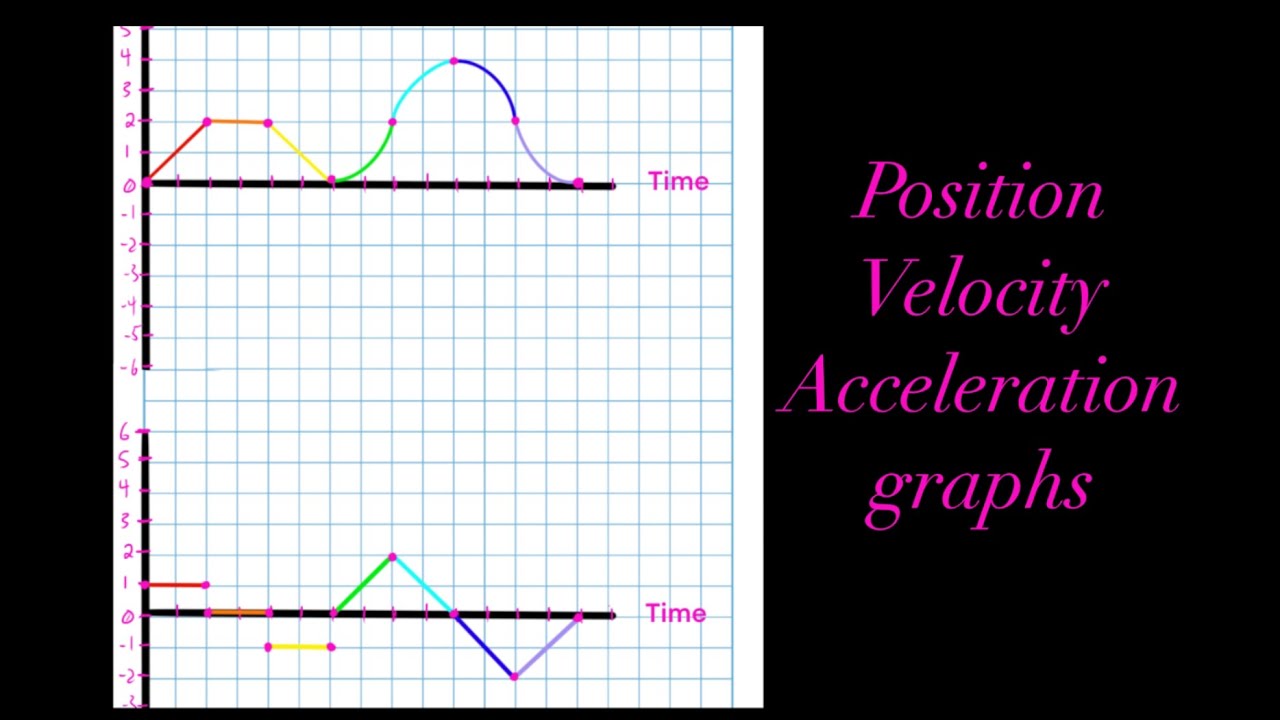
- 🔄 Understanding the concavity of curves in the graphs is crucial; concave up indicates positive acceleration, while concave down indicates negative acceleration.
- 🧮 The area under the velocity graph represents displacement, and the area under the acceleration graph can be used to find changes in velocity.
- 📐 Area formulas for geometric shapes (square, rectangle, triangle) are essential for analyzing motion diagrams, with the circle being a notable exception (area = πr²).
Q & A
What is the primary purpose of discussing motion diagrams in the context of AP Physics?
-The primary purpose is to provide a better understanding of the concepts of position, velocity, and acceleration as they relate to one another, and to demonstrate how these concepts change over time.
How does the motion diagram represent displacement?
-Displacement is represented on the motion diagram by the X-axis, indicating the change in position along the horizontal direction.
What does the slope of the velocity graph indicate?
-The slope of the velocity graph indicates the rate of change of velocity. An increasing slope represents increasing velocity, while a constant slope indicates constant velocity.
How can you determine positive acceleration from the acceleration graph?
-Positive acceleration is indicated by a slope that is going up at a constant value, showing that the velocity is increasing at a steady rate.
What does a flat or zero slope in the acceleration graph signify?
-A flat or zero slope in the acceleration graph signifies that there is no change in velocity, meaning the acceleration is zero.
How can the shape of the velocity graph help in understanding the motion?
-The shape of the velocity graph, whether it is curving up, curving down, or is linear, helps to understand if the motion is speeding up, slowing down, or moving at a constant speed.
What does the concavity of the velocity graph imply about the motion?
-If the concavity of the velocity graph is down, it implies that the motion is decelerating or slowing down.
How can you identify the maximum position from the motion diagram?
-The maximum position can be identified as the point where the slope changes from positive to negative, indicating the highest point or the farthest distance traveled.
Why can't you determine the velocity being zero from the acceleration graph?
-You cannot determine the velocity being zero from the acceleration graph because the graph only shows the rate of change of velocity, not the actual velocity values.
What is the significance of the area under the velocity graph?
-The area under the velocity graph represents the displacement, which can be used to calculate the total change in position over a given time period.
What are the key area formulas to remember when analyzing motion diagrams?
-The key area formulas to remember include the area of a square (side squared), the area of a rectangle (length times width), and the area of a triangle (1/2 times base times height). For circles, the formula is π times the radius squared.
Outlines
📊 Understanding Motion Diagrams
This paragraph introduces the concept of motion diagrams to AP Physics students, emphasizing their importance in understanding the relationship between position, velocity, and acceleration. The speaker explains that motion diagrams can represent displacement, velocity, and acceleration in the X and Y directions. The key points discussed include the interpretation of slopes (constant for constant velocity, increasing for increasing velocity, and curving for acceleration or deceleration). The speaker also clarifies that the area under the velocity-time graph represents displacement, and the area under the acceleration-time graph represents change in velocity. The explanation is enriched with examples and mathematical notations to aid in the comprehension of the motion diagram's significance in physics.
📉 Analyzing Velocity and Acceleration in Motion Diagrams
The second paragraph delves deeper into the analysis of motion diagrams, focusing on the interpretation of velocity and acceleration. The speaker clarifies that a curving motion diagram indicates a change in velocity, which could be either positive or negative, and that the slope's direction (upward for positive acceleration and downward for negative acceleration) is indicative of the nature of the change. The paragraph also discusses how the flattening of a curve in the velocity graph signifies a velocity becoming less negative or more positive. The speaker reiterates the importance of understanding the relationship between the slope of the graphs and the physical quantities they represent, as well as the calculation of areas for different shapes to determine displacement and changes in velocity. The summary concludes with a brief overview of the key area formulas needed for the analysis of motion diagrams.
Mindmap
Keywords
💡motion diagram
💡displacement
💡velocity
💡acceleration
💡slope
💡area
💡constant velocity
💡positive acceleration
💡negative acceleration
💡work
💡algebra
Highlights
Introduction to motion diagrams for AP Physics students.
Motion diagrams help understand the relationship between position, velocity, and acceleration.
X-axis represents displacement, Y-axis can represent velocity or acceleration depending on the graph.
Increasing slope in a graph indicates increasing velocity.
A straight line in the velocity graph indicates constant velocity.
Constant slope in the acceleration graph indicates constant acceleration.
Positive slope in the acceleration graph indicates positive acceleration.
No slope in the graph indicates zero velocity or acceleration.
A curve in the graph that concaves up indicates positive acceleration.
A curve in the graph that concaves down indicates negative acceleration.
The maximum position is where the velocity graph crosses zero.
A horizontal point in the acceleration graph implies a change from positive to negative velocity.
A flattening curve in the velocity graph implies the velocity is becoming less negative.
The area under the velocity graph represents displacement.
The area under the acceleration graph can be calculated using basic algebra and geometry.
Common area formulas to remember are for squares, rectangles, and triangles, and the circle area is PI R squared.
Understanding motion diagrams is crucial for solving a variety of physics problems.
Transcripts
Browse More Related Video
Visualizing Motion Using Tape Charts and Motion Graphs | SCIENCE 7 QUARTER 3 MODULE 2 WEEK 3
Position vs Time, Velocity vs Time & Acceleration vs Time Graph (Great Trick to Solve Every Graph!!)

Describing Motion With Diagrams
Motion Diagram
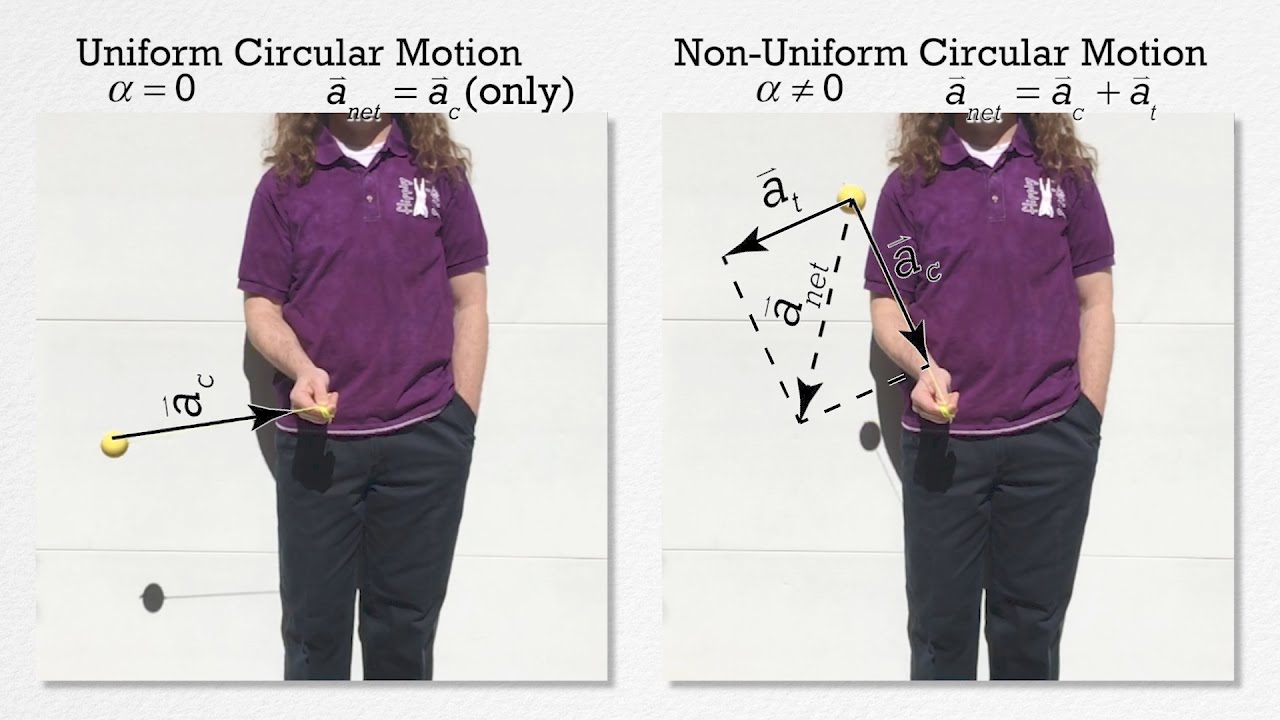
AP Physics C: Rotational Kinematics Review (Mechanics)
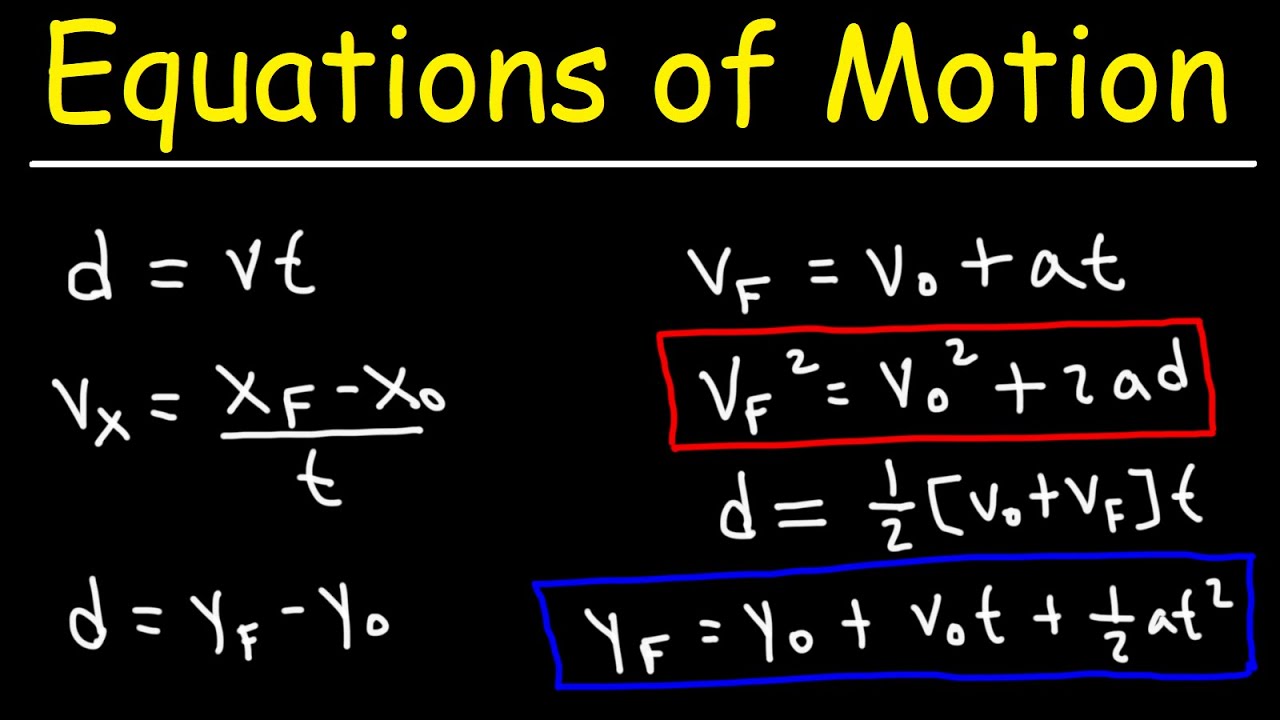
Equations of Motion
5.0 / 5 (0 votes)
Thanks for rating: